
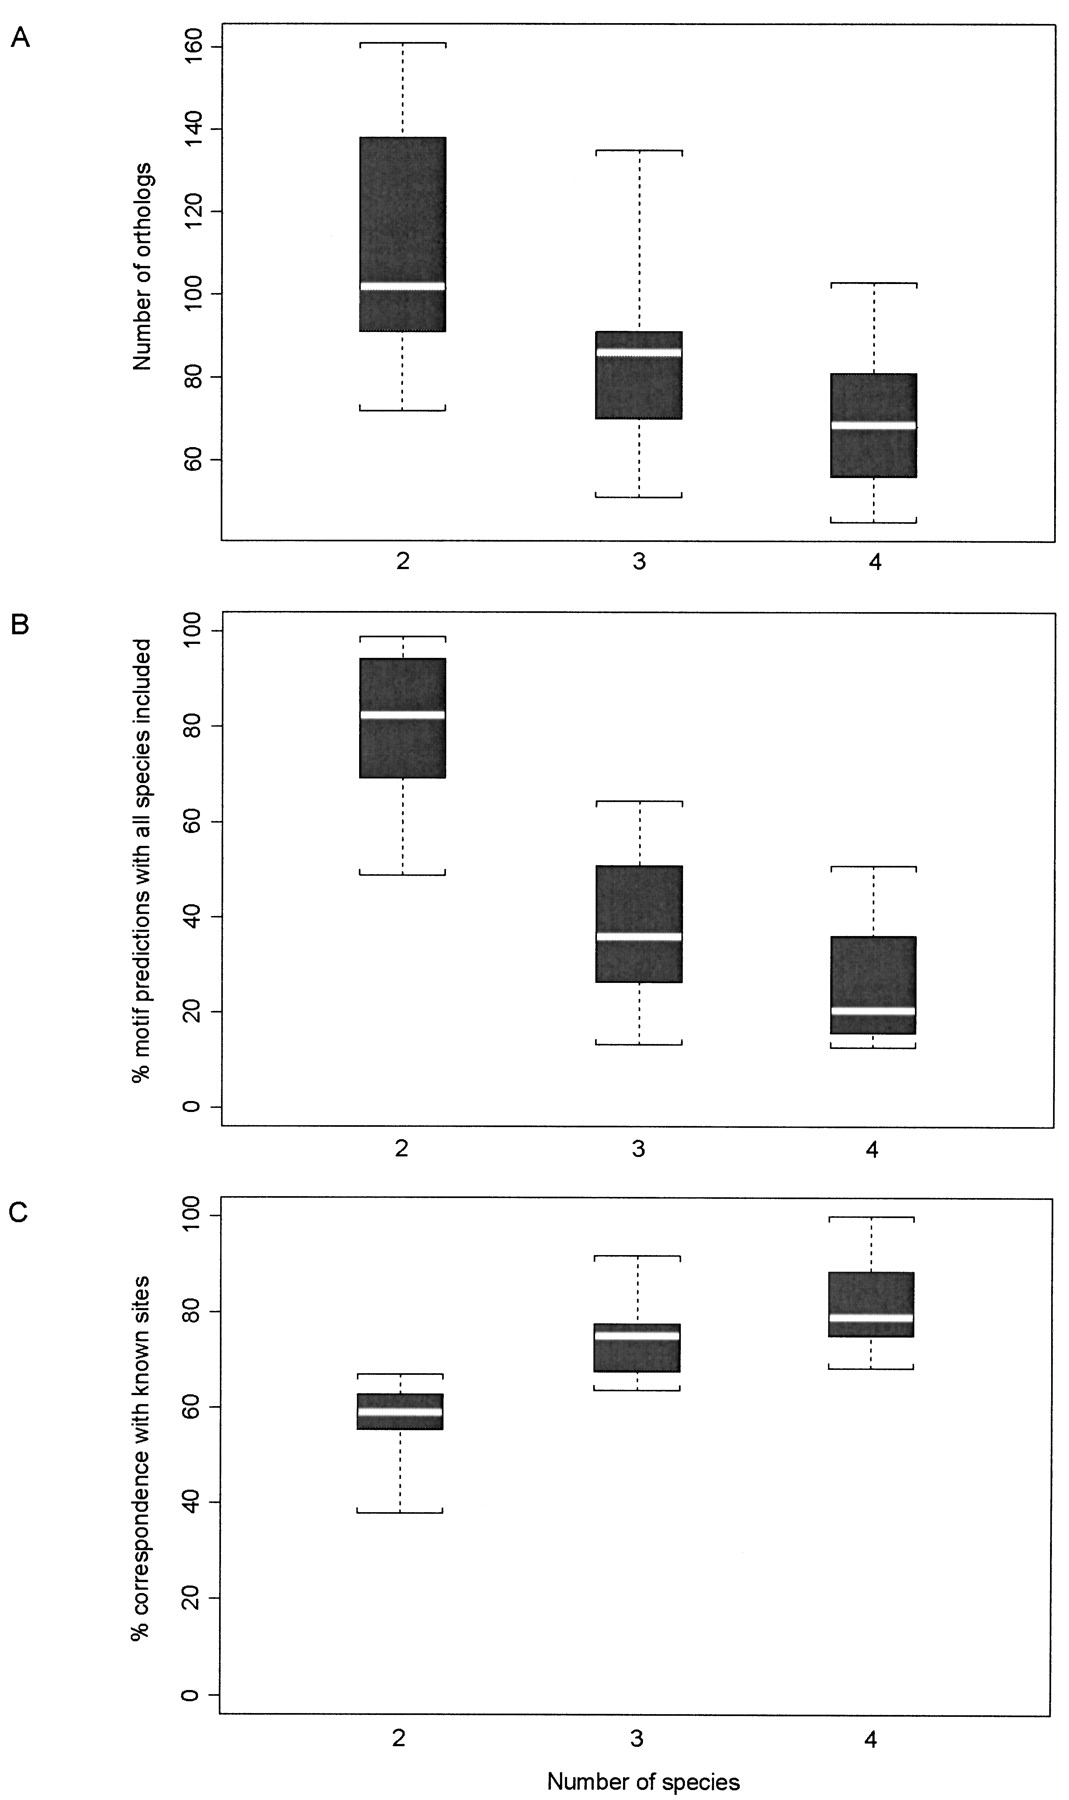
Boxplots representing the phylogenetic footprinting results of the study set for several species combinations: six combinations of two species, 15 combinations of three species, and 20 combinations of four species (see supplemental data for details). (A) The number of orthologous data sets. For combinations of two species, the upper boundary was the Escherichia coli–Salmonella enterica serovar typhi (S. typhi) combination, with 161 data sets, and the lower boundary was the E. coli–Haemophilus influenzae combination, with 72 data sets. (B) The percentage of motif predictions that included sites from all of the species in the data for each combination of species. For combinations of two species, the upper boundary was theE. coli–S. typhi combination, at 98.8%, and the lower boundary was the E. coli–Pseudomonas aeruginosa combination, at 48.9%. (C) The percent correspondence with known transcription factor binding sites for each combination of species. For combinations of two species, the upper boundary was the E. coli–Yersinia pestiscombination, at 66.2%, and the lower boundary was the E. coli–P. aeruginosa combination, at 35.5%. The whiskers represent the species combinations with the highest and lowest numbers (A) or the highest and lowest percentages (B,C); the black boxes encompass the regions between the upper and lower quartiles, and the white lines indicate the medians.


