
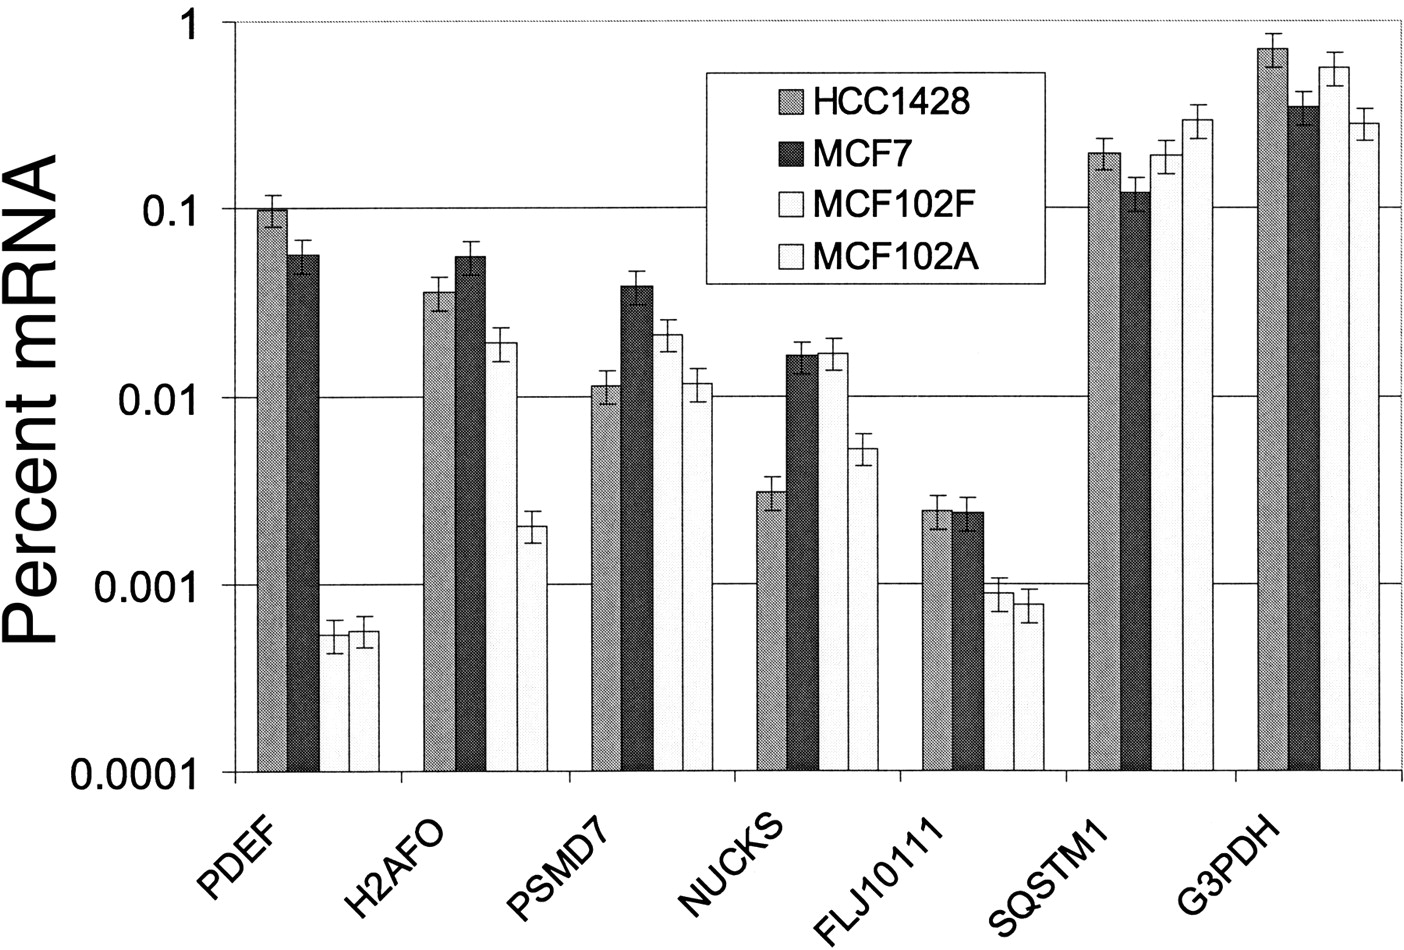
Figure 2.
Real-time PCR data quantifying the levels of mRNA transcript for each indicated gene in four different cell lines.
(Downloading may take up to 30 seconds. If the slide opens in your browser, select File -> Save As to save it.)
Click on image to view larger version.
Real-time PCR data quantifying the levels of mRNA transcript for each indicated gene in four different cell lines.
 CiteULike
 Delicious
 Digg
Digg Facebook
 Google+
 Reddit
 Twitter
