
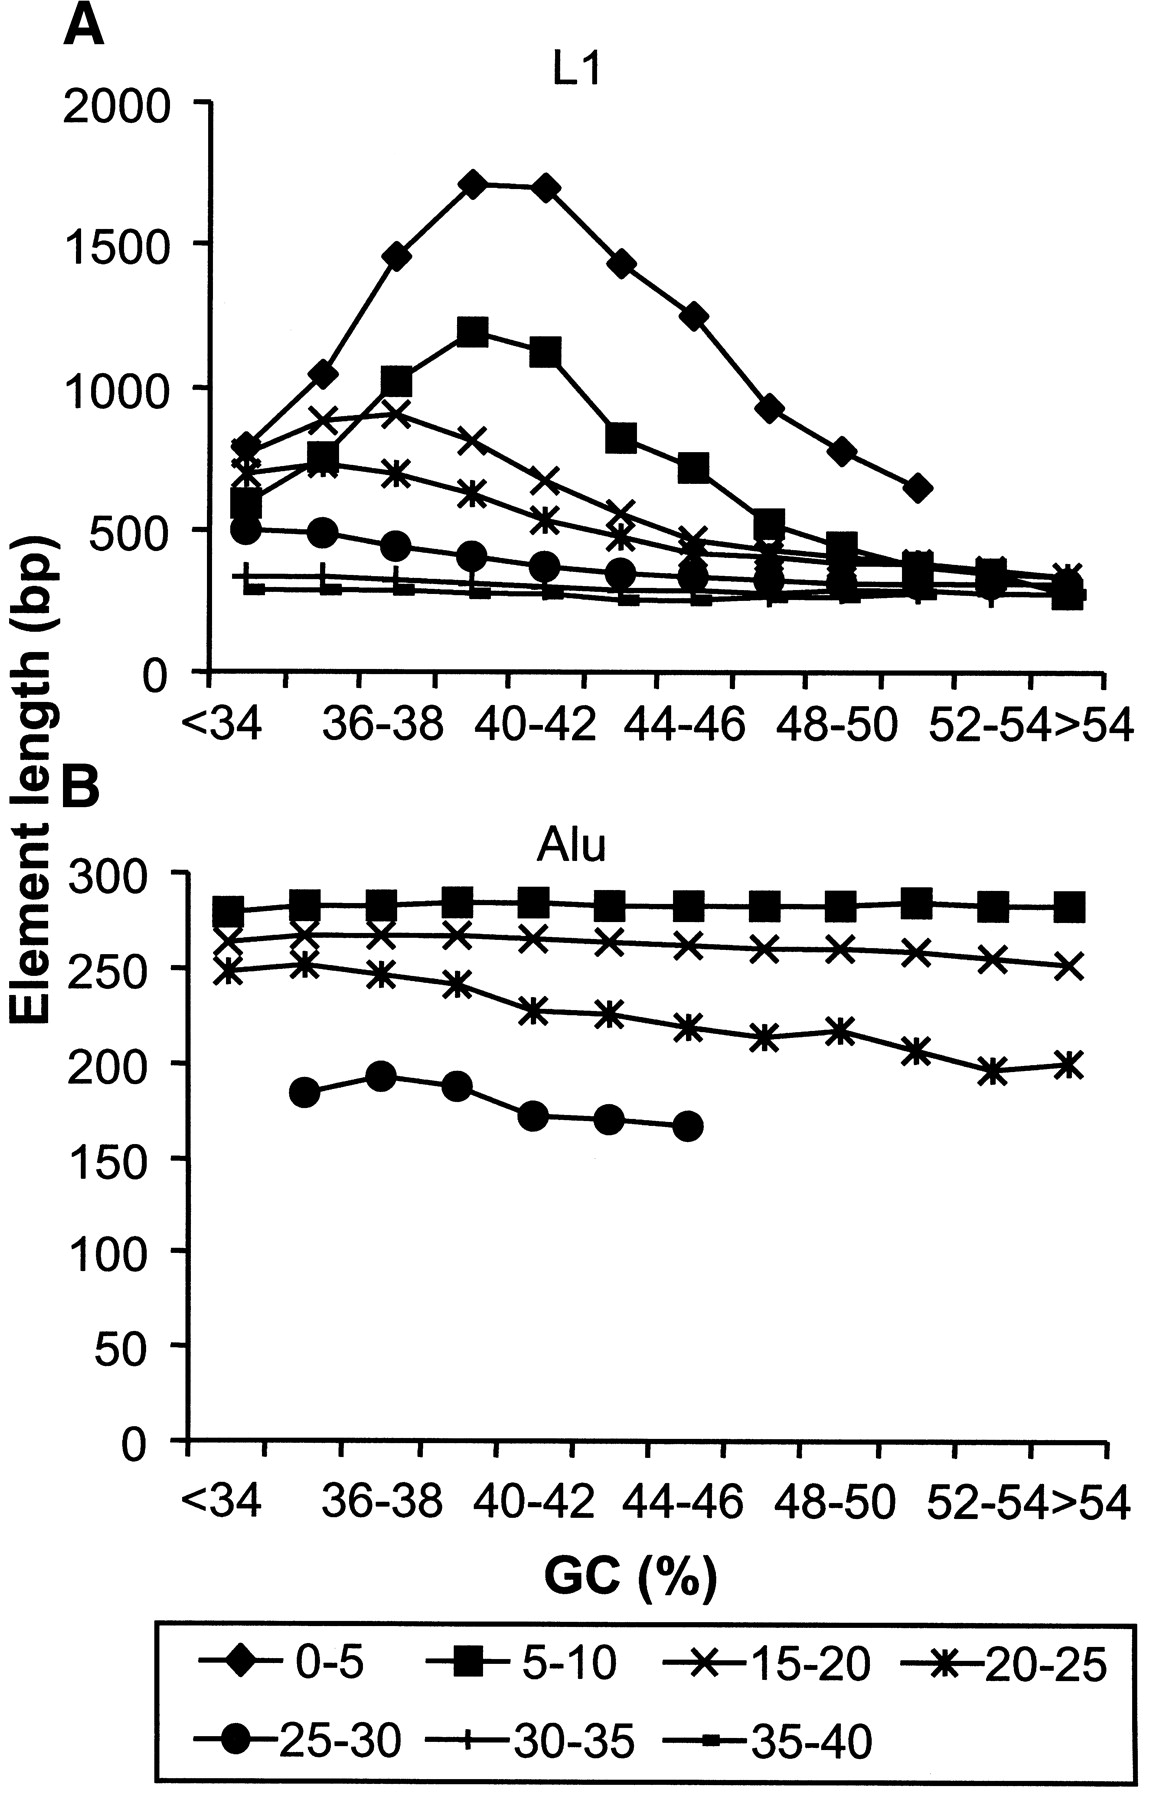
Figure 5.
Length distribution of retroelements with respect to surrounding GC content. Retroelements of each group were classified as belonging to divergence cohorts as described in the text. The average length in base pairs (bp) of each retroelement divergence cohort contained within each GC bin (see legend to Fig. 1) is shown for L1 (A) and Alu (B) elements. GC bins containing <100 elements were excluded from the graphs.


