
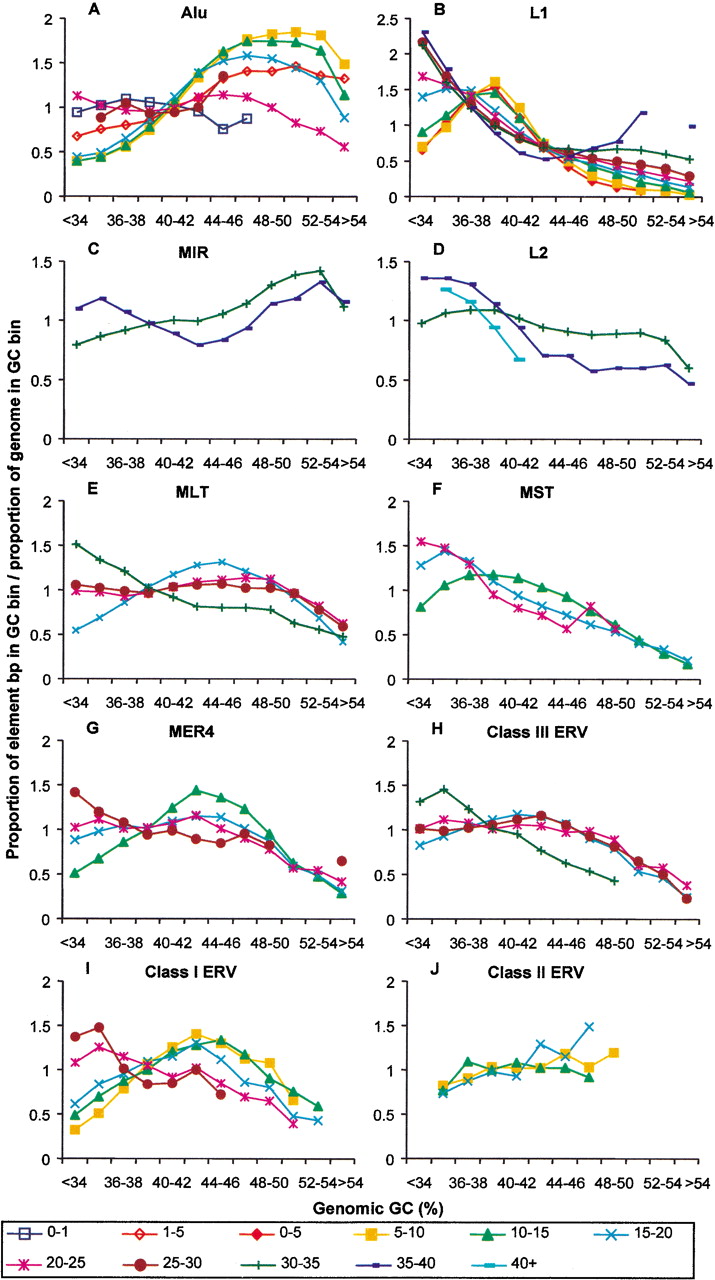
Figure 4.
Retroelement densities of different divergence classes in various GC fractions of the human genome. The density distribution of each retroelement divergence cohort was plotted in GC bins as indicated in the legend to Figure 1. The divergence classes are indicated in % divergence from the consensus sequence below the graphs. Data points missing in traces are due to GC bins containing <100 elements. Standard deviations were calculated (see Methods) but are not shown in the interest of clarity.


