
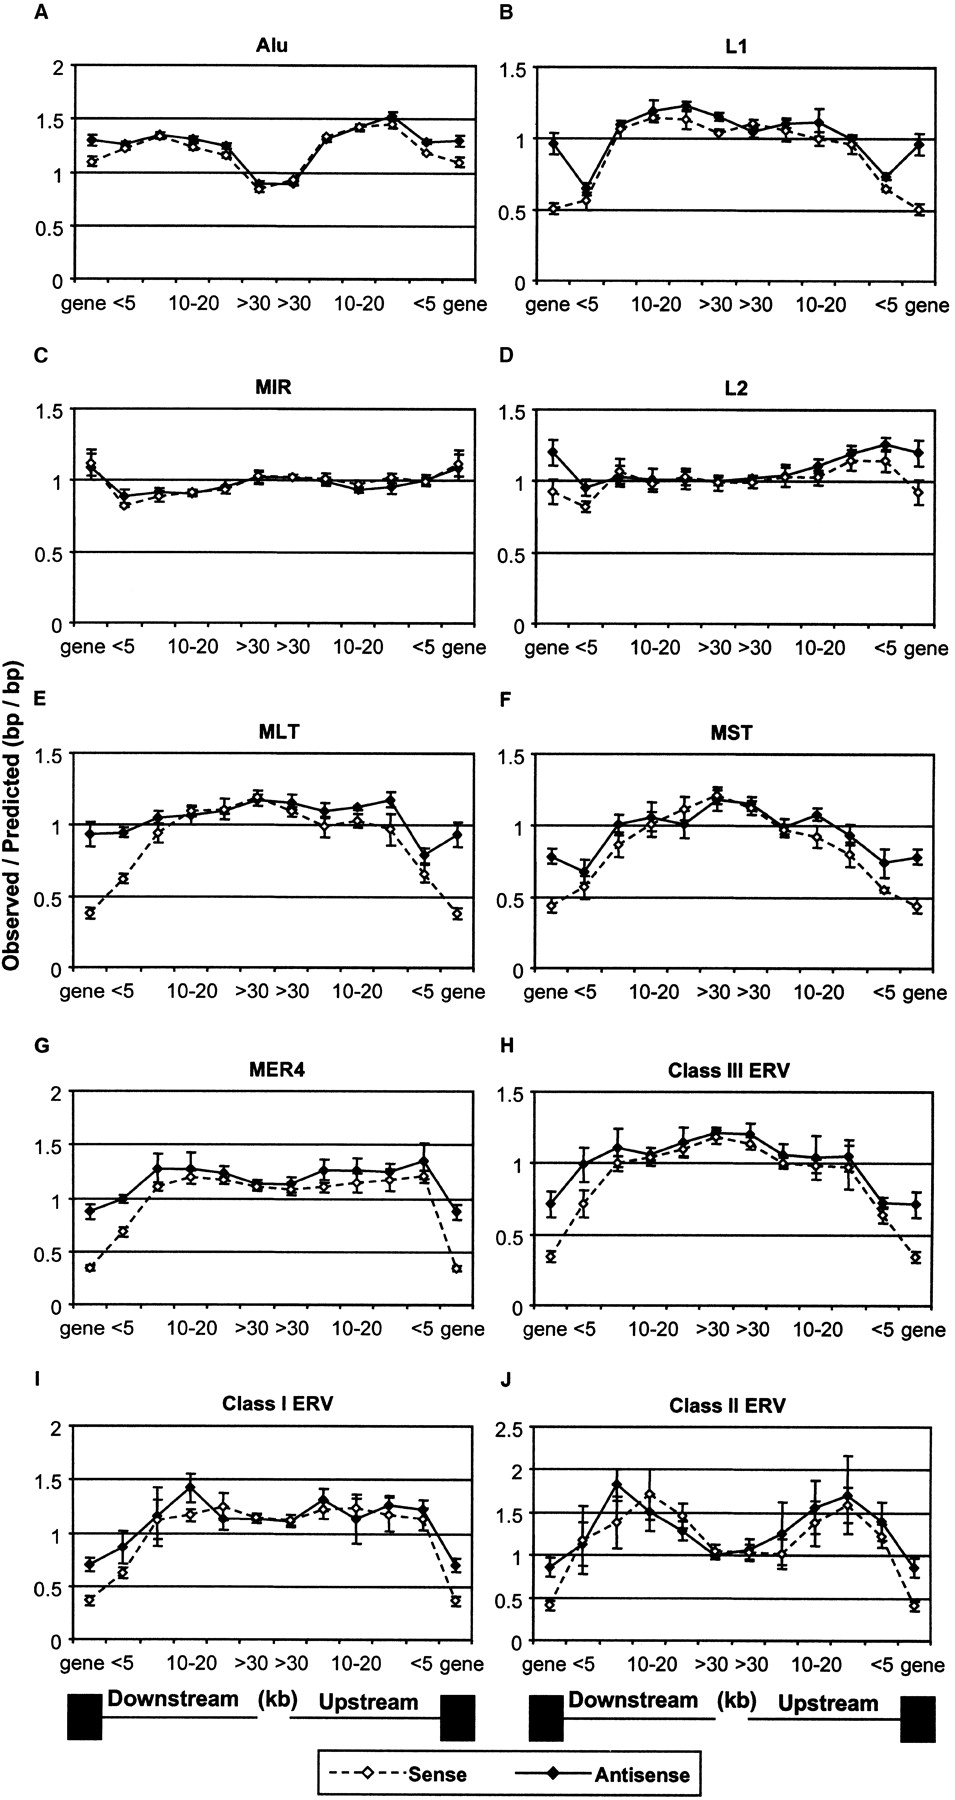
Ratios of observed to predicted retroelement densities with respect to genes in the human genome. The points above “gene” and “<5” of each graph indicate the density in gene regions, and in the first 5 kb either 5′ or 3′ of genes. The other bins are 5–10, 10–20, 20–30, and >30 kb either upstream or downstream of genes. Open symbols and broken lines indicate elements in the same or sense orientation with respect to the nearest gene and solid symbols and lines indicate elements in the reverse direction. Standard deviation error bars, which are too small to see in some cases, were determined as described in Methods. Solid boxes below the graphs represent gene regions and the lines indicate the distance bins of the intergenic regions. It should be noted that the vast majority of retroelements within genes are located in introns.


