
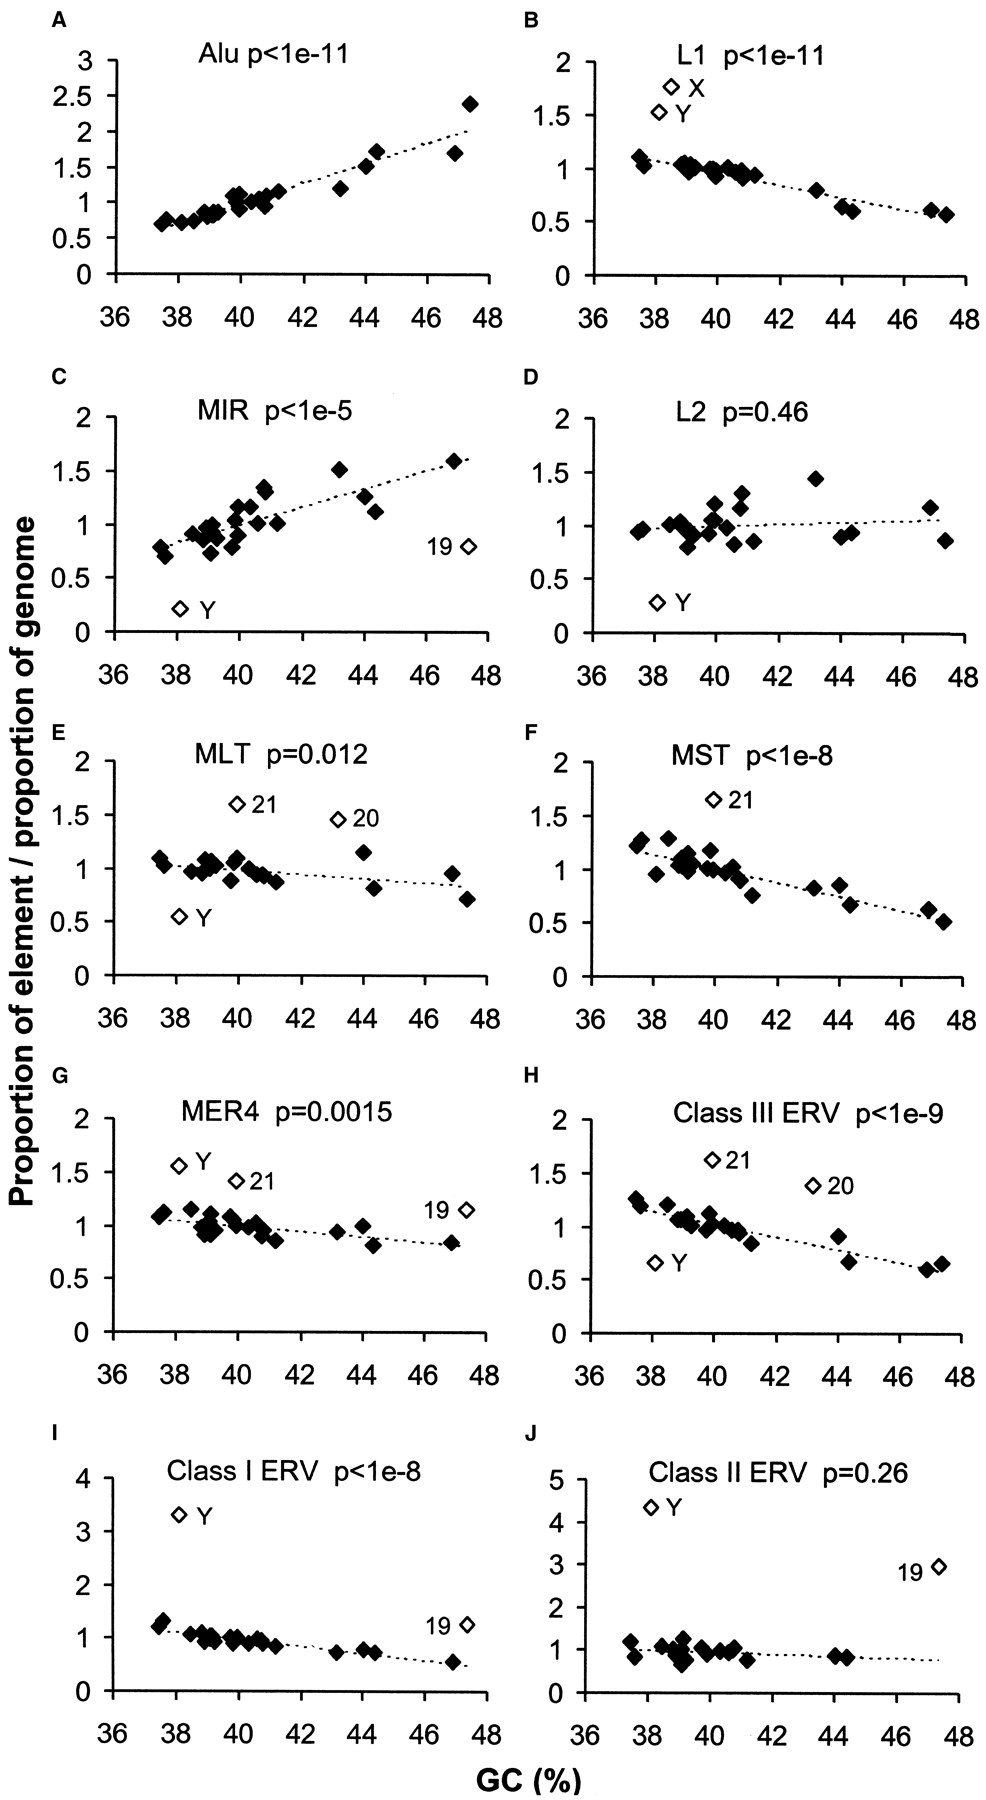
Figure 2.
Density of retroelements as a function of average GC content of each human chromosome. The line connecting solid diamonds indicates the general correlation trend between retroelement and GC content of individual chromosomes. The level of significance (P values) of the correlation for each data set is indicated. Open diamonds were excluded from the correlation analysis and indicate over- or underrepresentation of retroelement density on a particular chromosome. Chromosomes 20, 21, and 22 were excluded from the Class II graph (J) because they had <100 supporting elements.


