
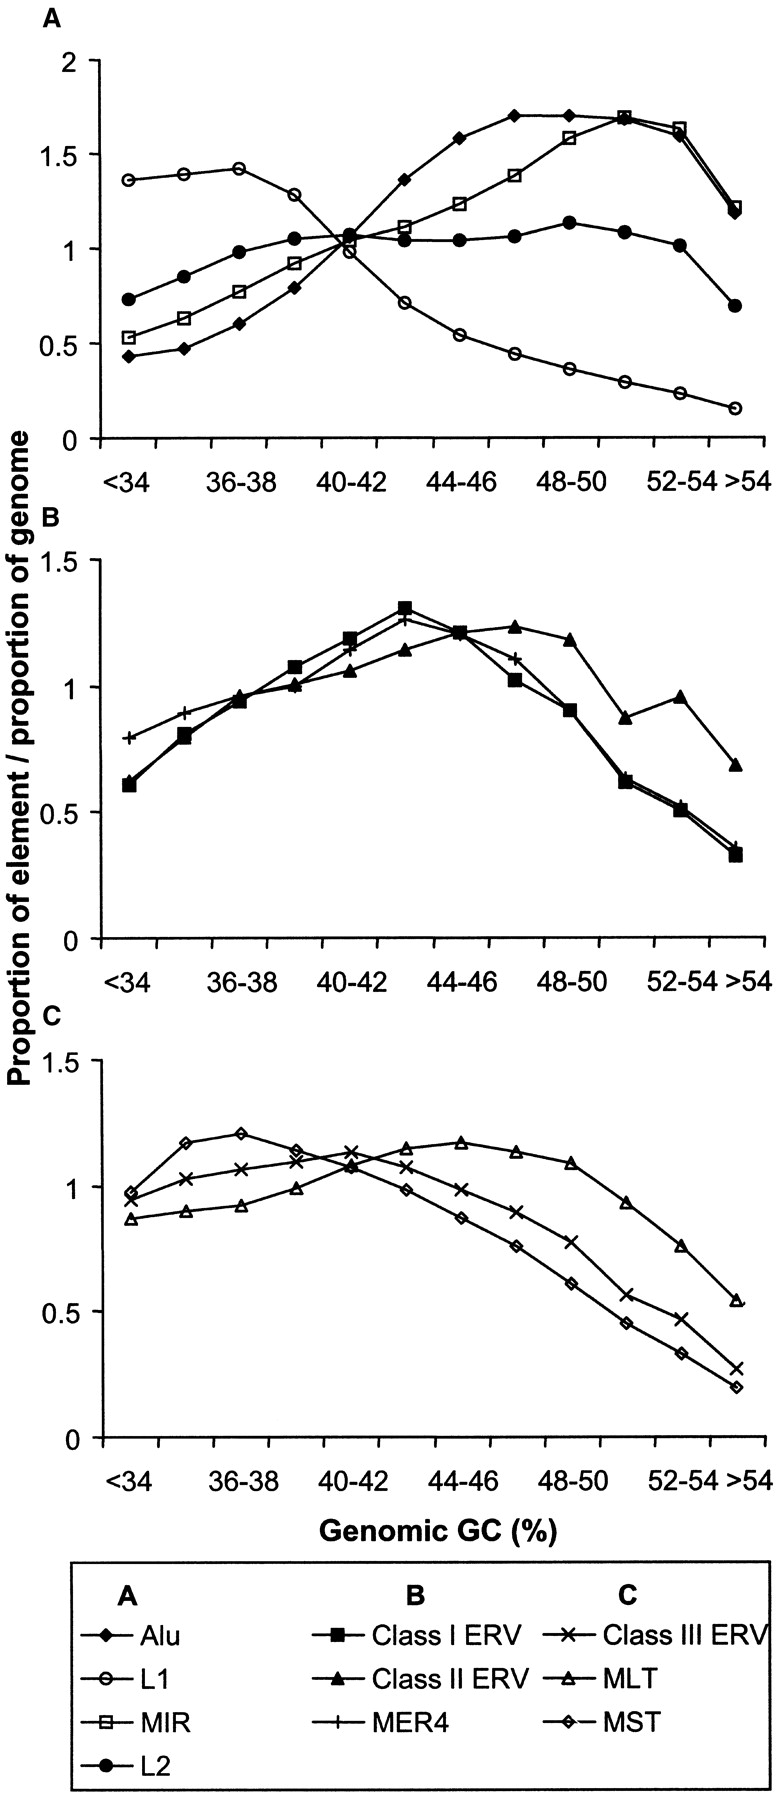
Figure 1.
Density of retroelements in different GC fractions in the human genome, calculated over 20-kb windows across the genome sequence. (A–C) The density of various retroelement classes. Those represented in each panel are indicated in the box below the graphs. The bins from left to right correspond to an increasing 2% GC fraction.


