
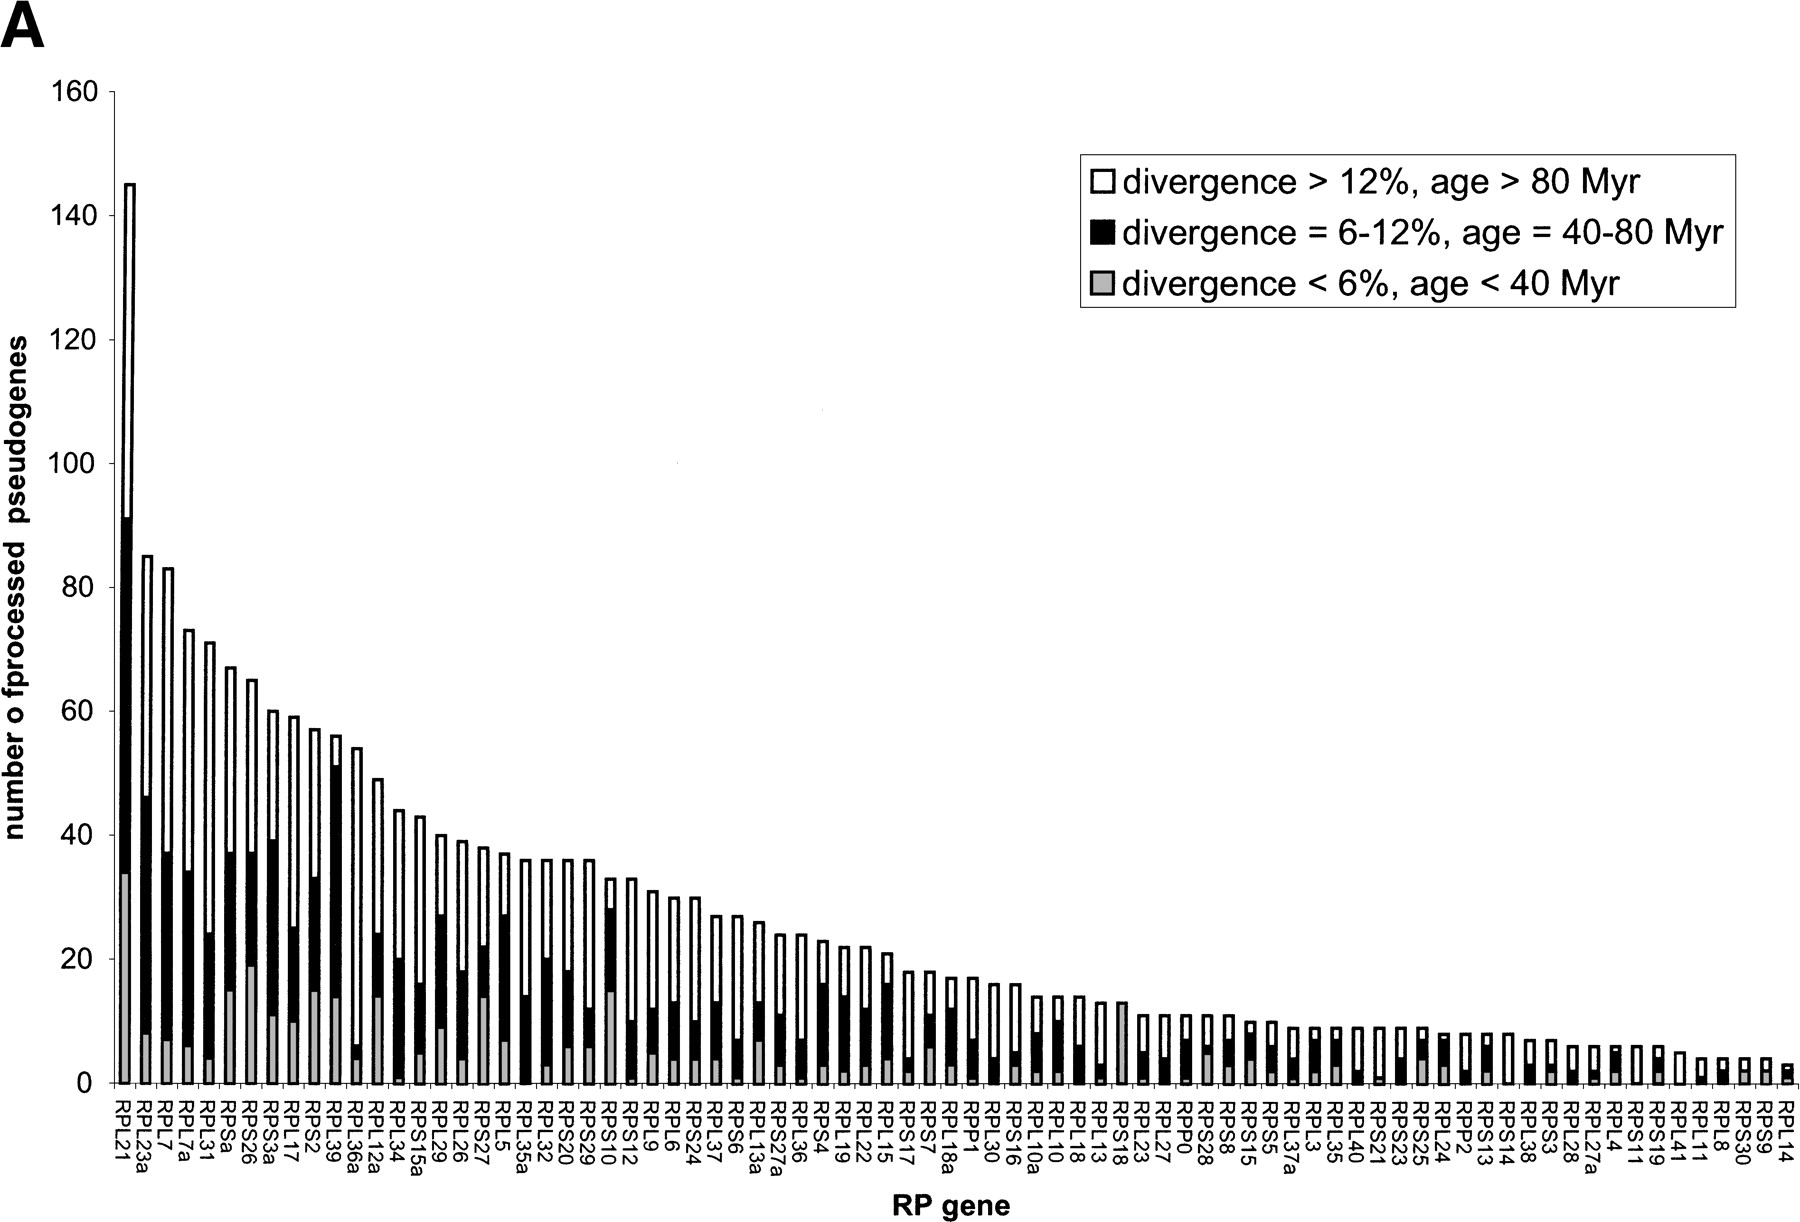
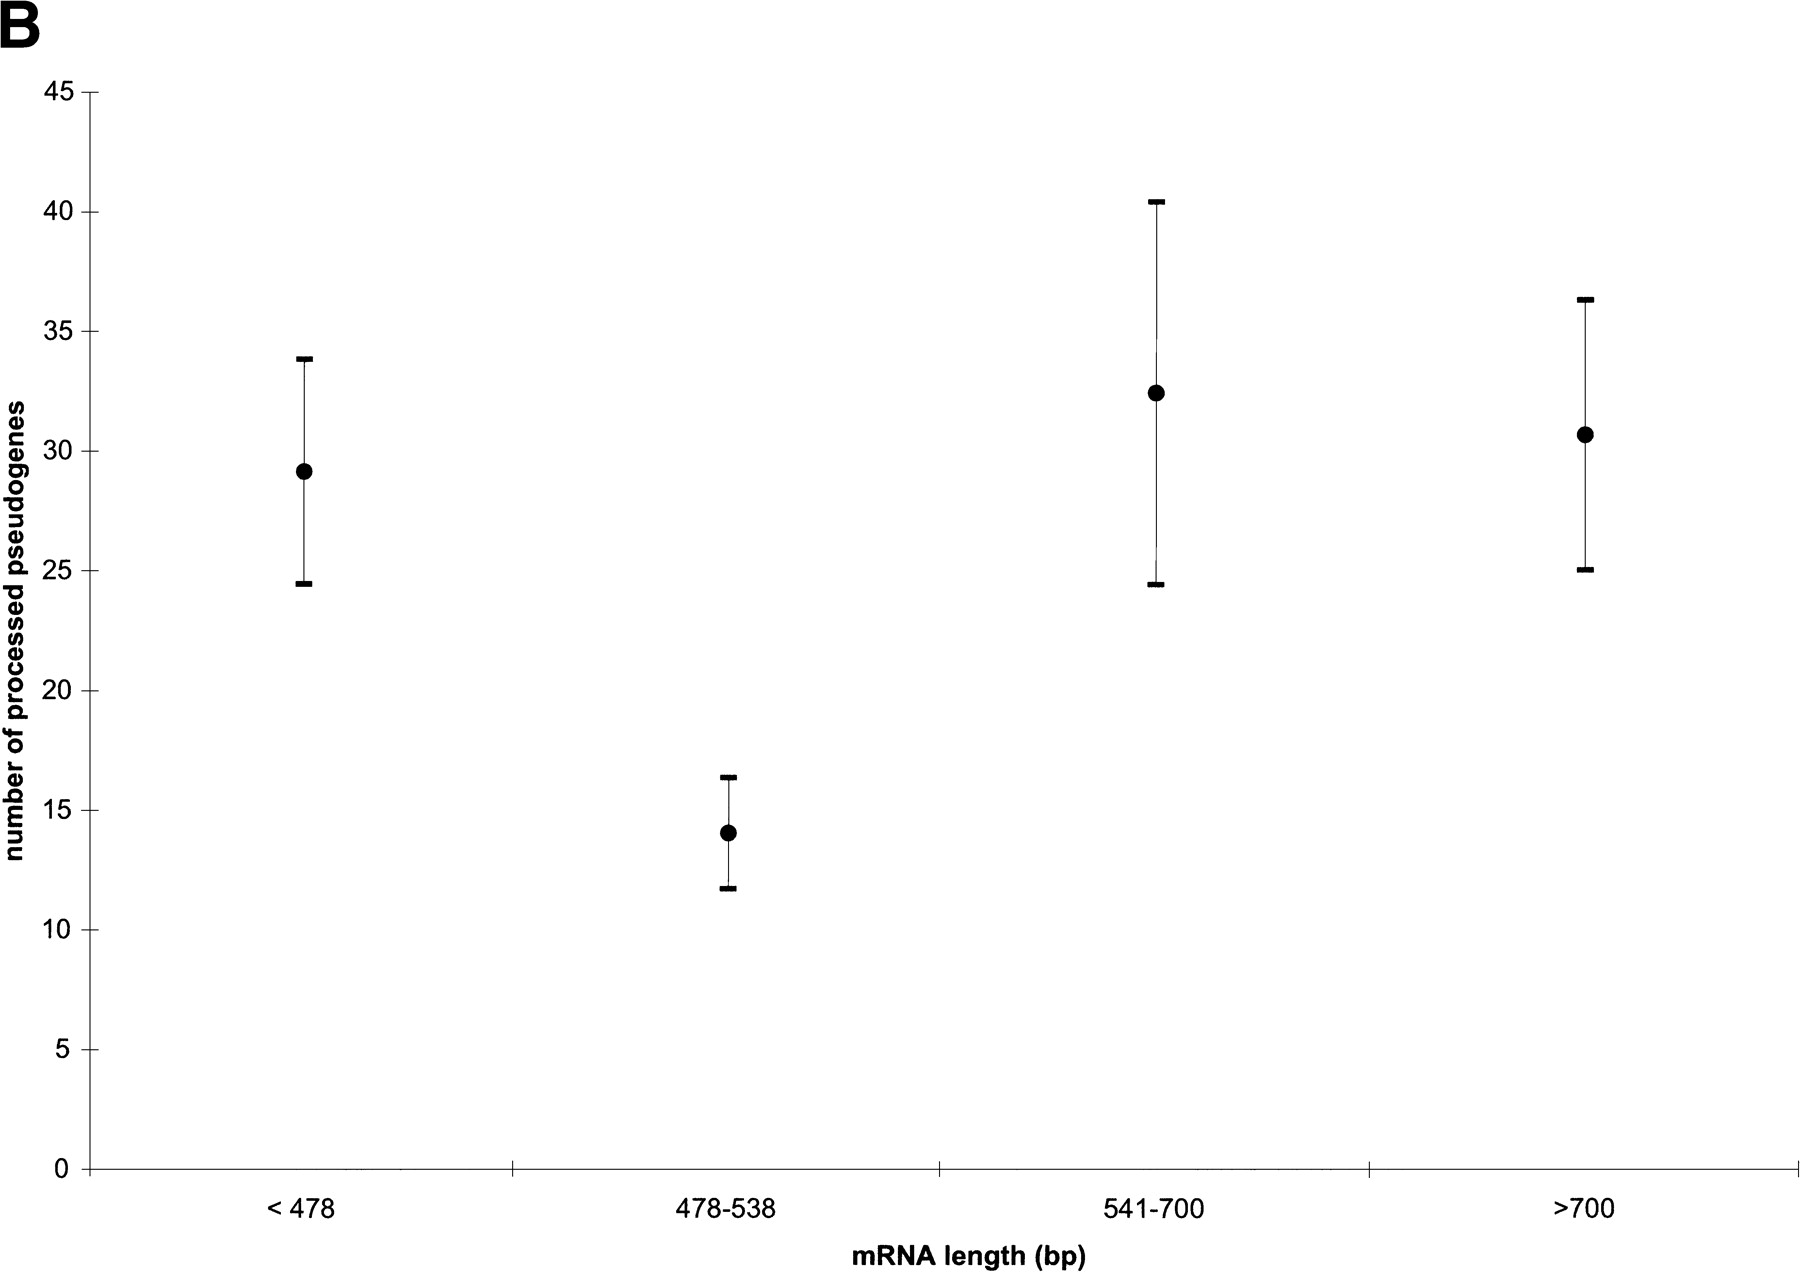
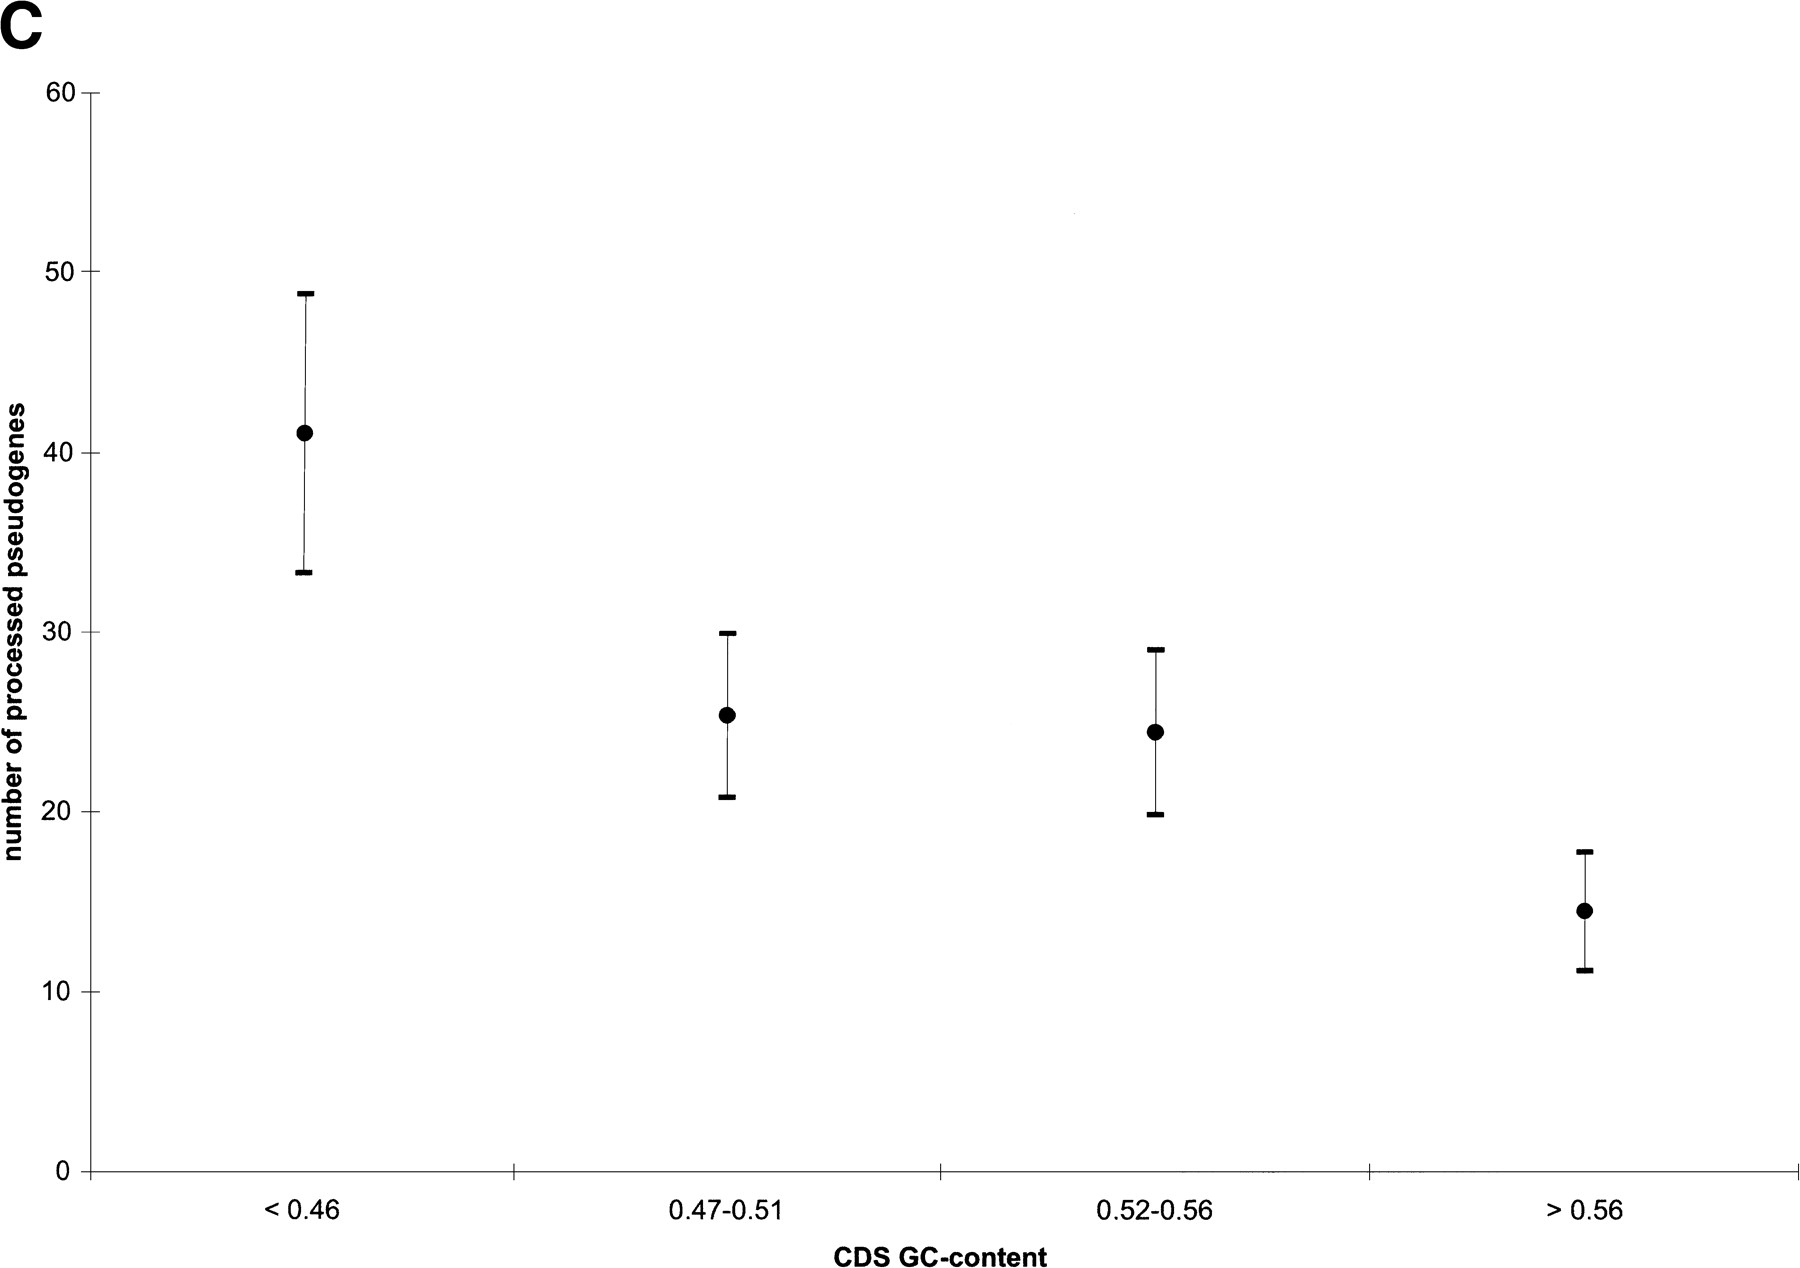
Figure 6.
(A) Distribution of processed pseudogenes among RP genes. Bars of different shades represent different age groups. (B) Lack of correlation between mRNA transcript length and number of processed pseudogenes. The pseudogenes are grouped into bins according to the length of their mRNA transcripts. Vertical bars are standard errors. (C) Significant inverse correlation between GC content of RP gene coding sequence (CDS) and number of processed pseudogenes for that RP. The RP genes are grouped into four bins according to their CDS GC content.


