
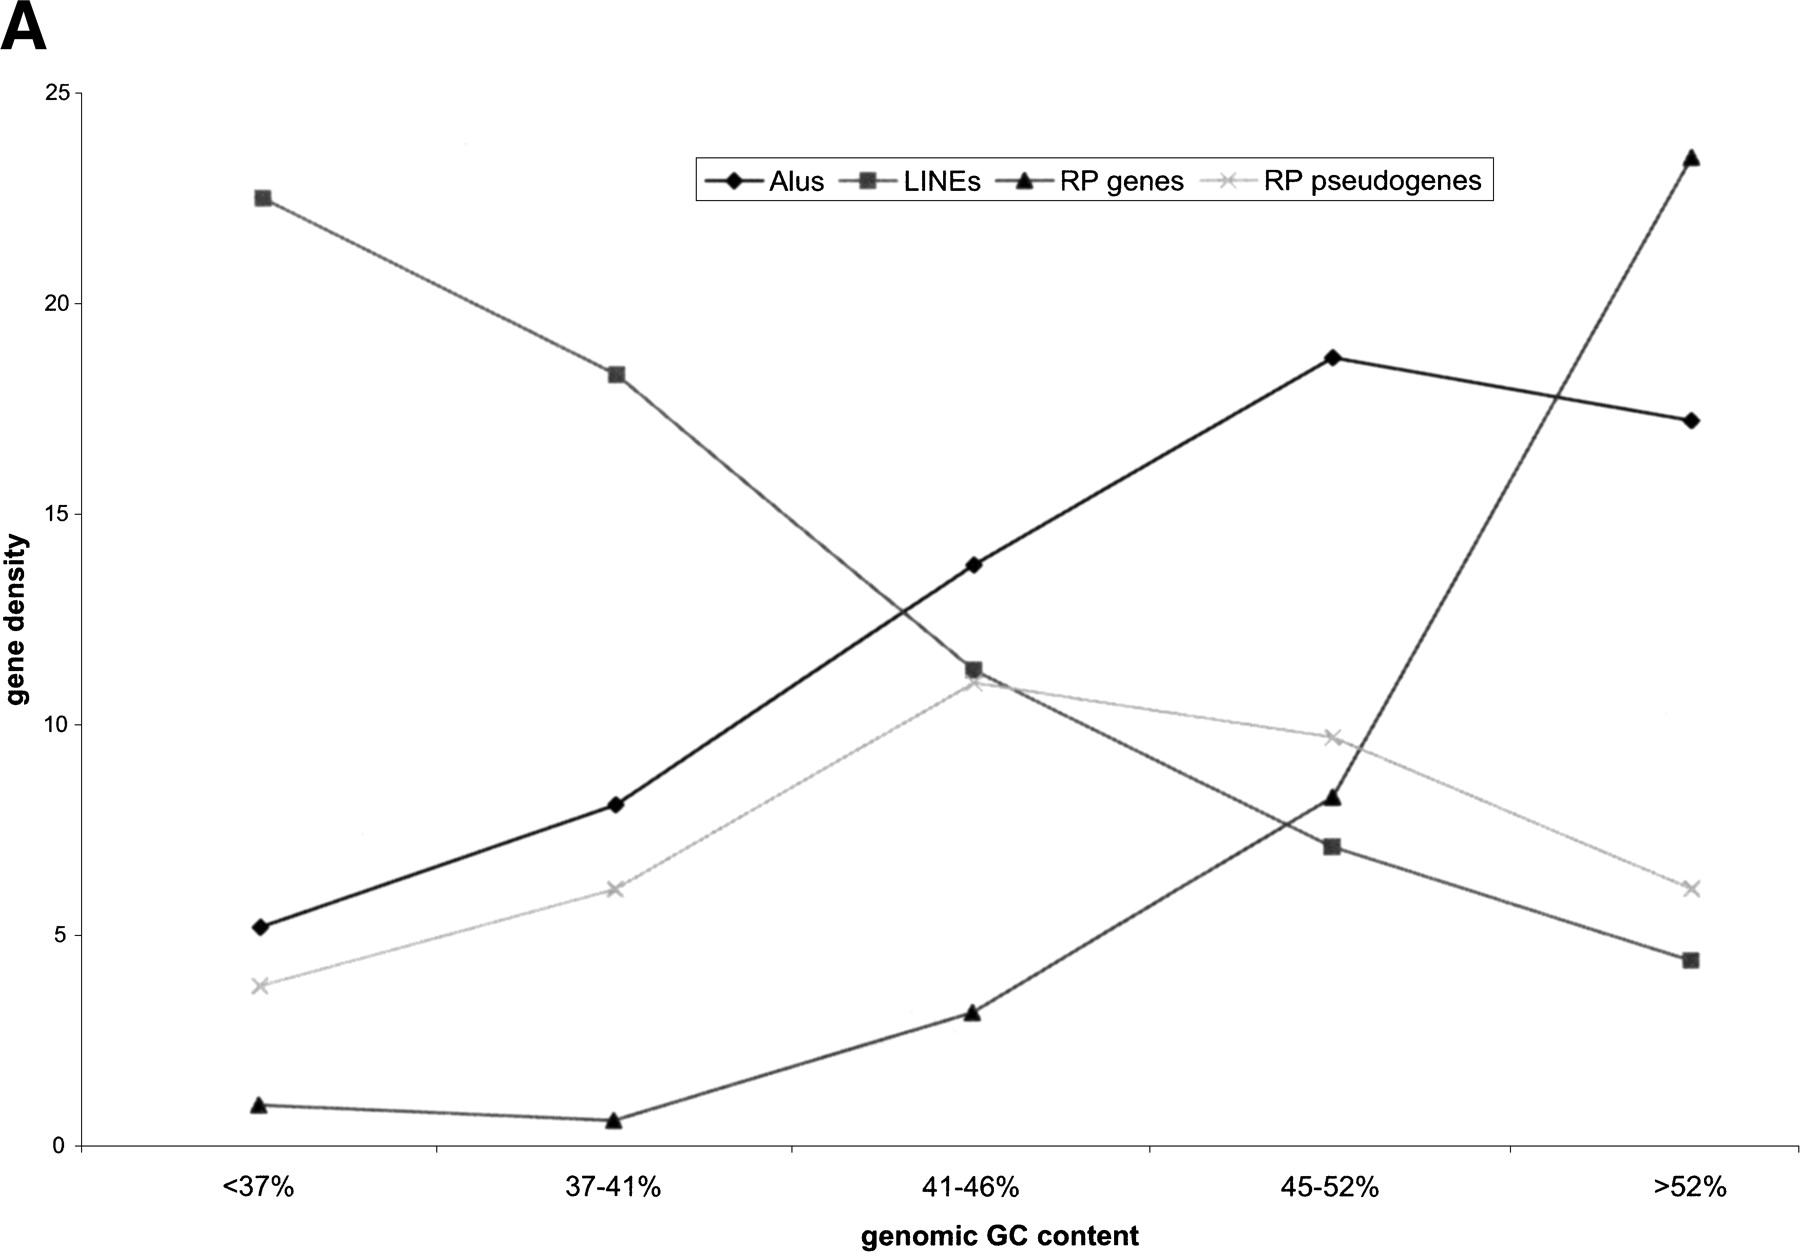
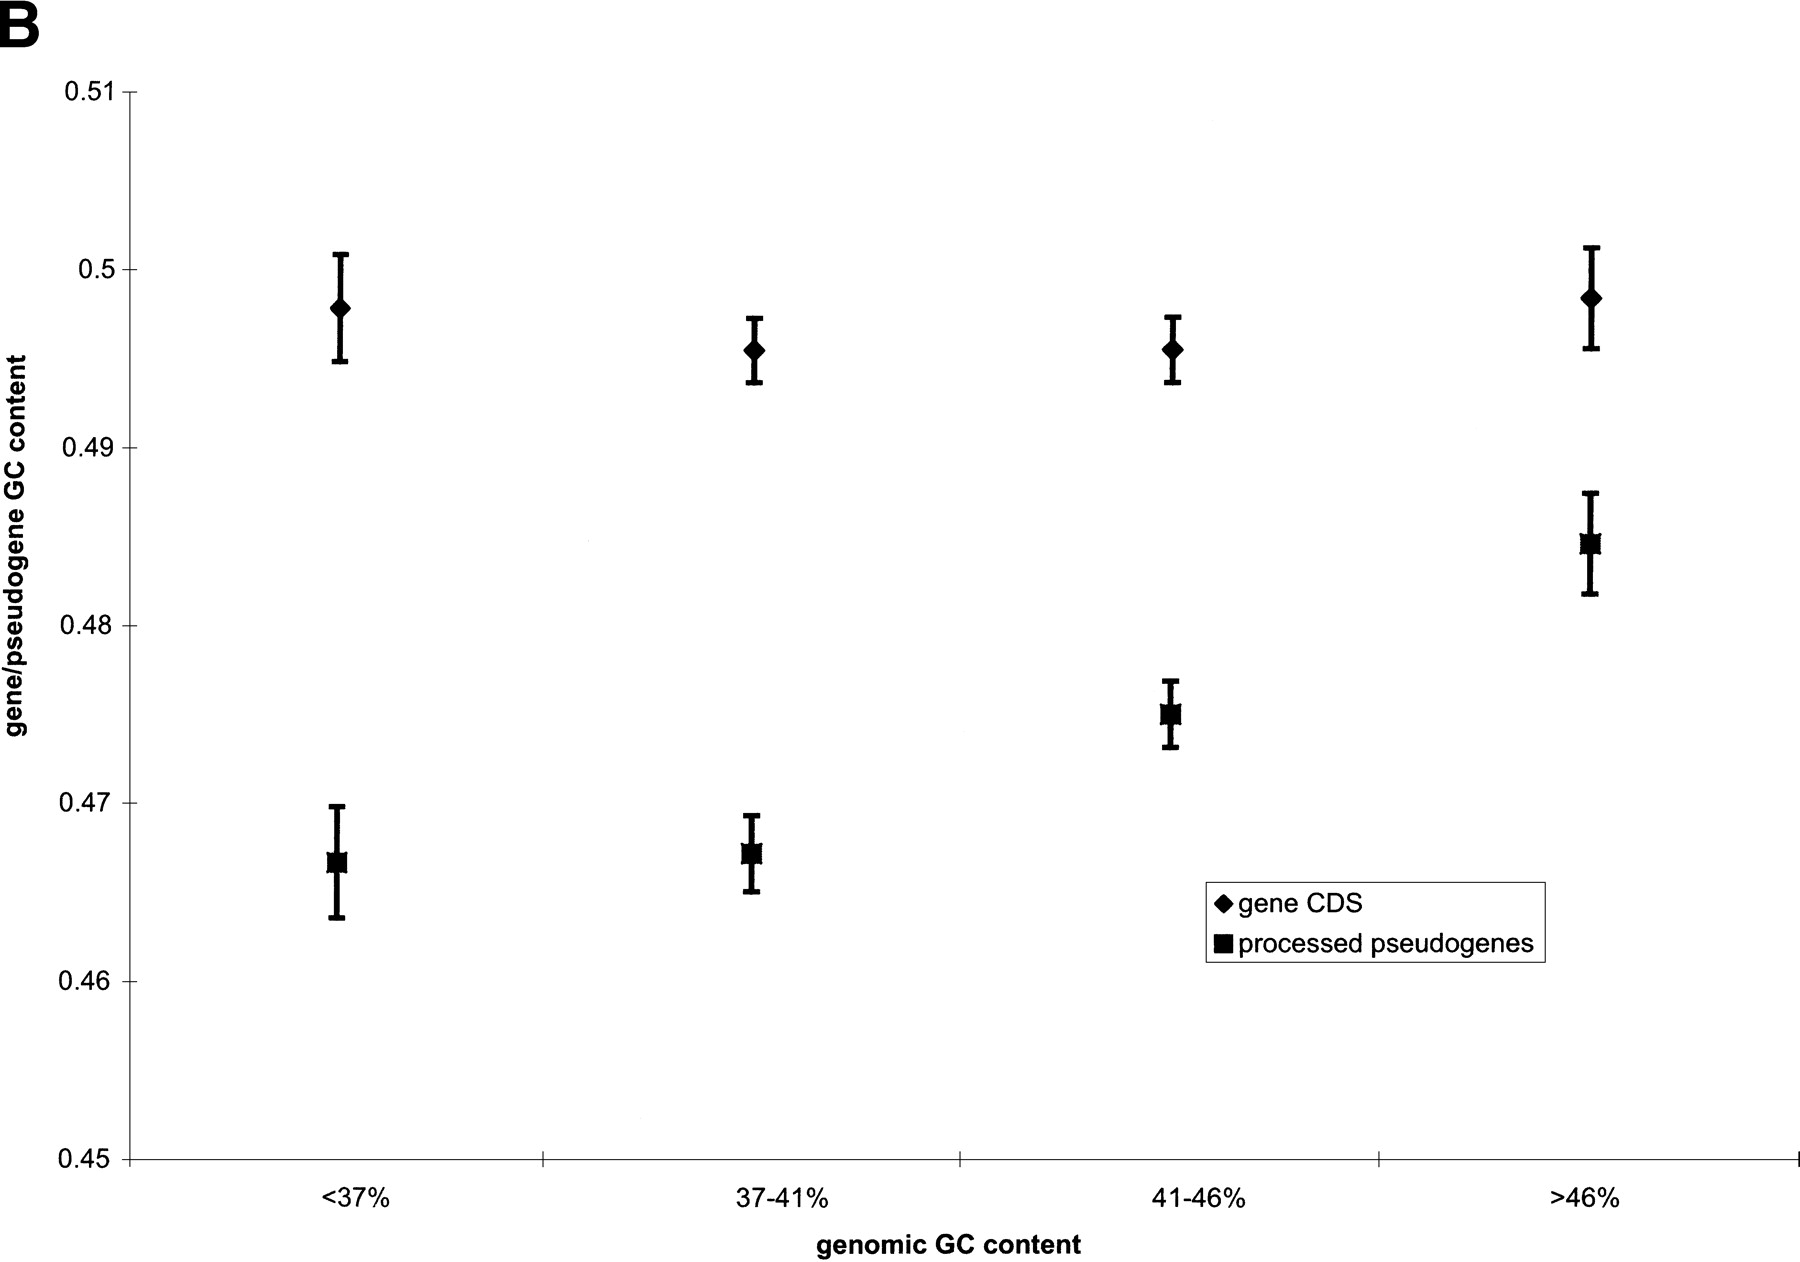
Figure 4.
(A) Distribution of Alu elements, LINE elements, processed RP pseudogenes, and functional RP genes among genomic regions of different GC content. Because of their different abundance in genome, these four species are plotted on different scales: number per 10Kb for Alus and LINEs, number per Mb for RP pseudogenes, and number per 100 Mb for functional RP genes. (B) The drift in GC content for RP processed pseudogenes. (♦) The GC content of functional RP gene coding sequence (CDS). (▪) The GC content of processed pseudogenes. The vertical bars are standard errors.


