
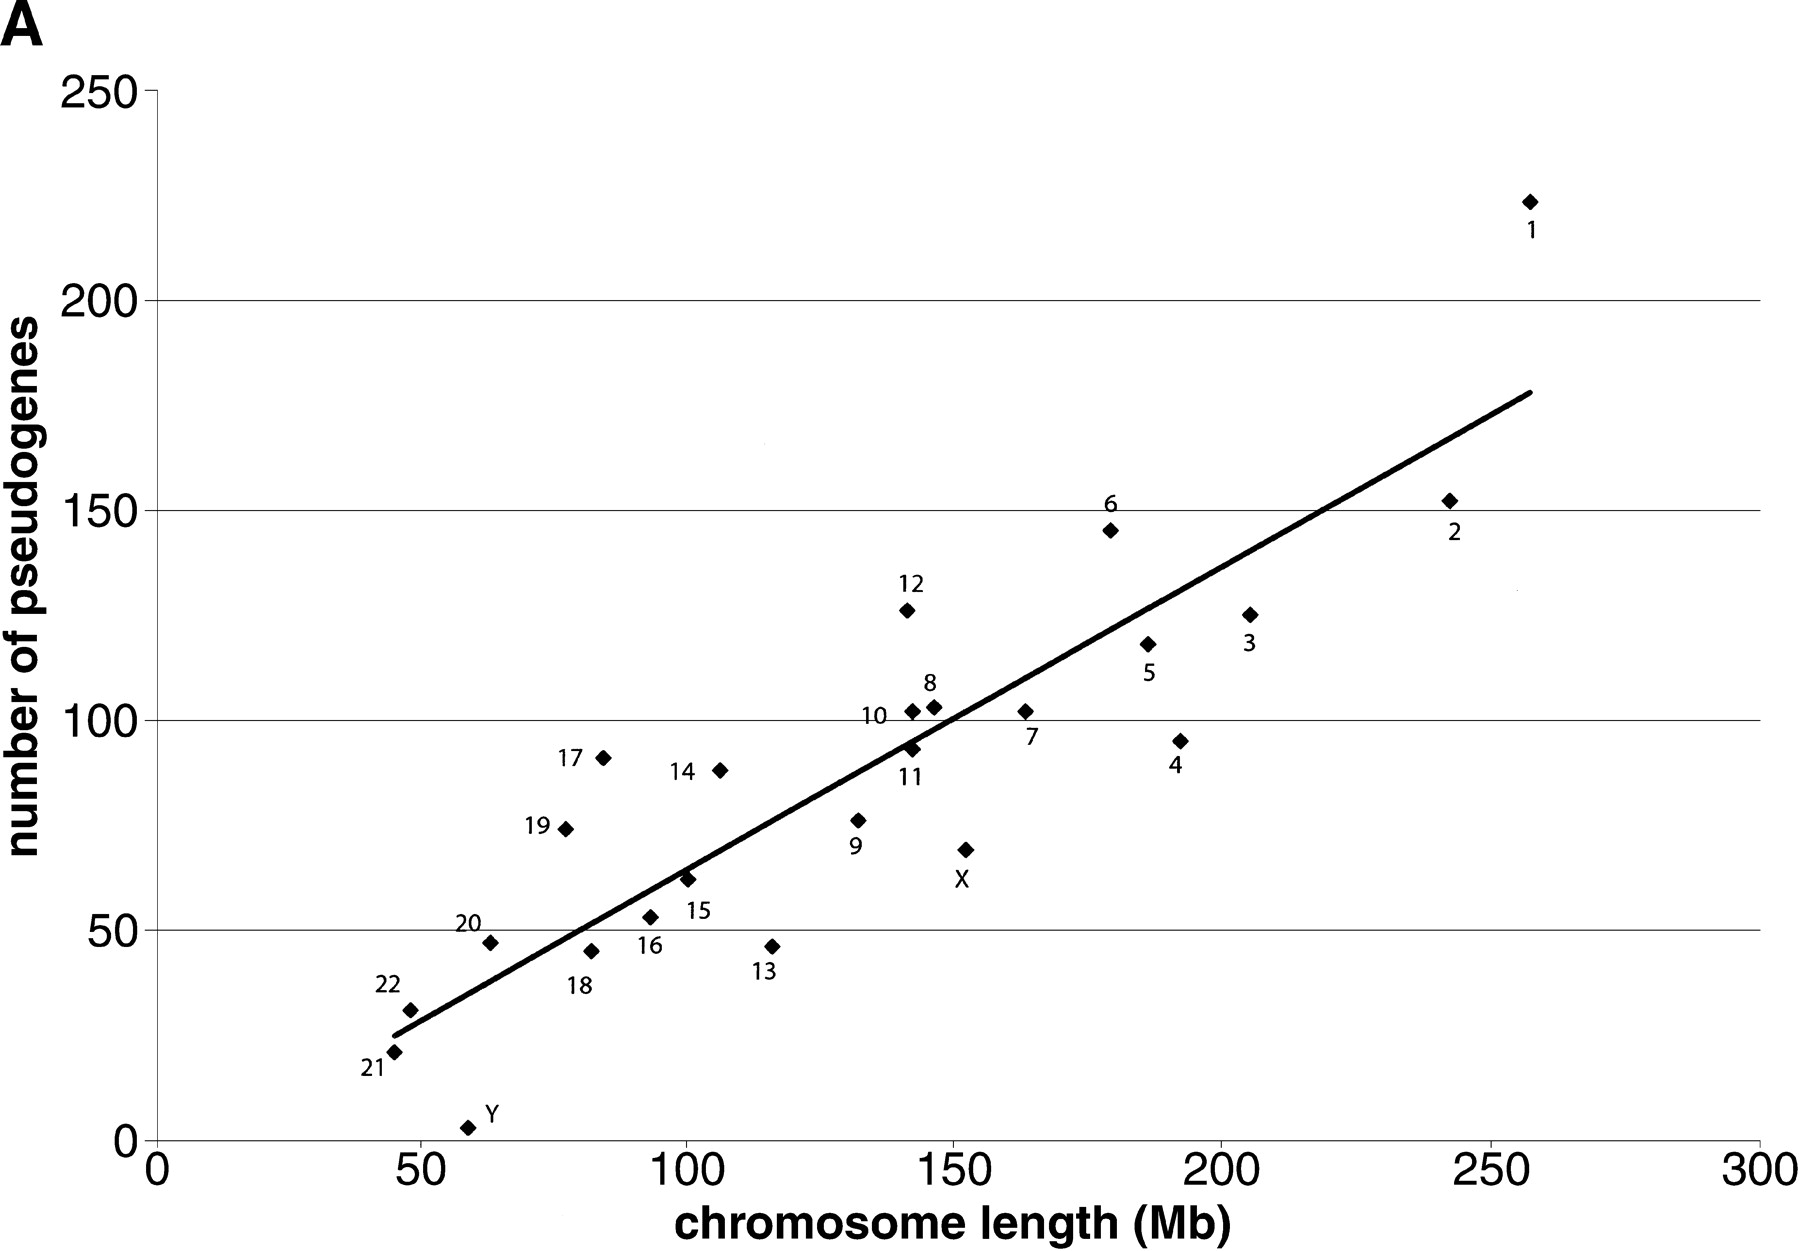
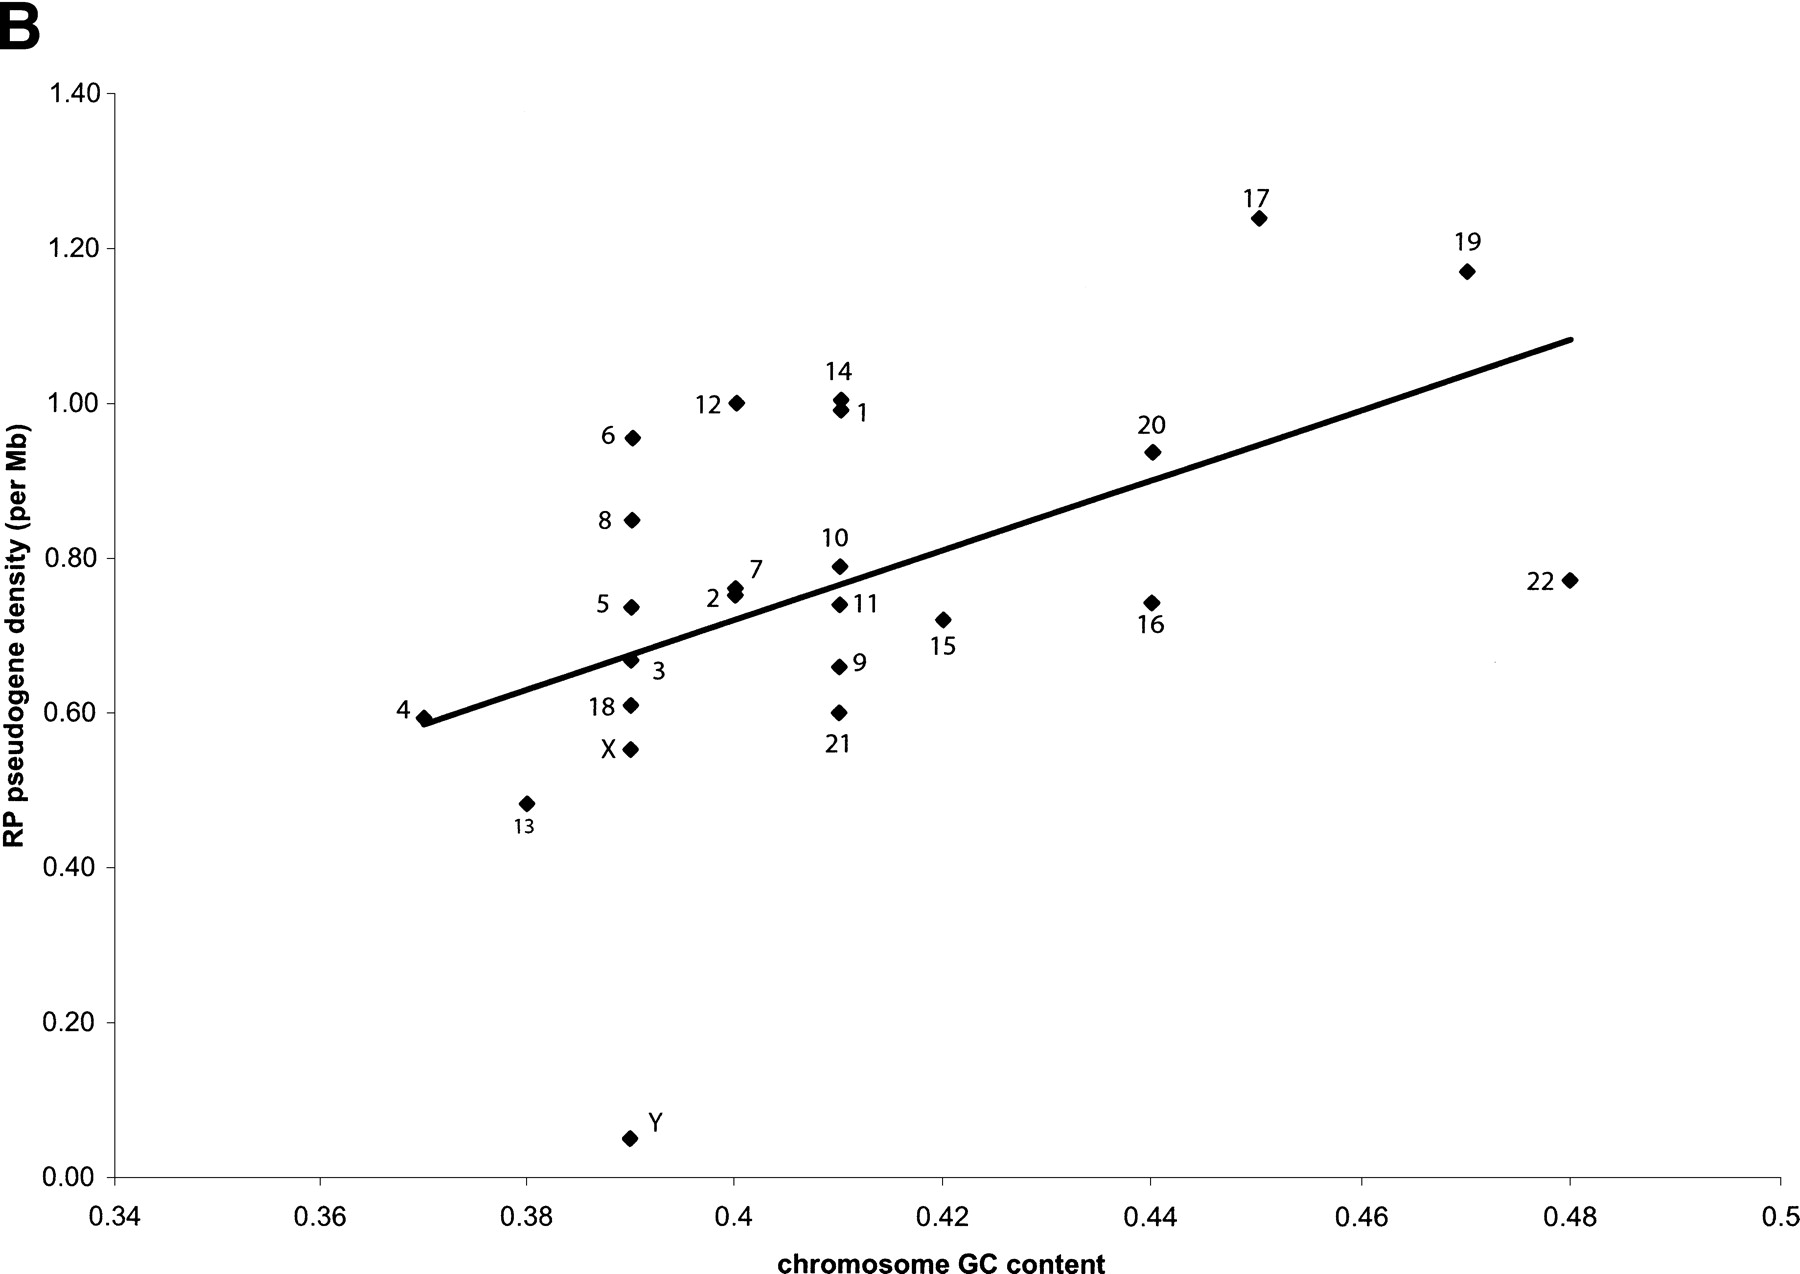
Figure 3.
(A) Correlation between chromosome length and number of processed RP pseudogenes on them. Each ♦ symbol represents a chromosome. The correlation between number of processed pseudogenes on each chromosome and chromosome length is 0.89, P<1E-8. (B) Processed pseudogene density on each chromosome is correlated with the chromosome GC content. The correlation coefficient is 0.51, P<0.01.


