
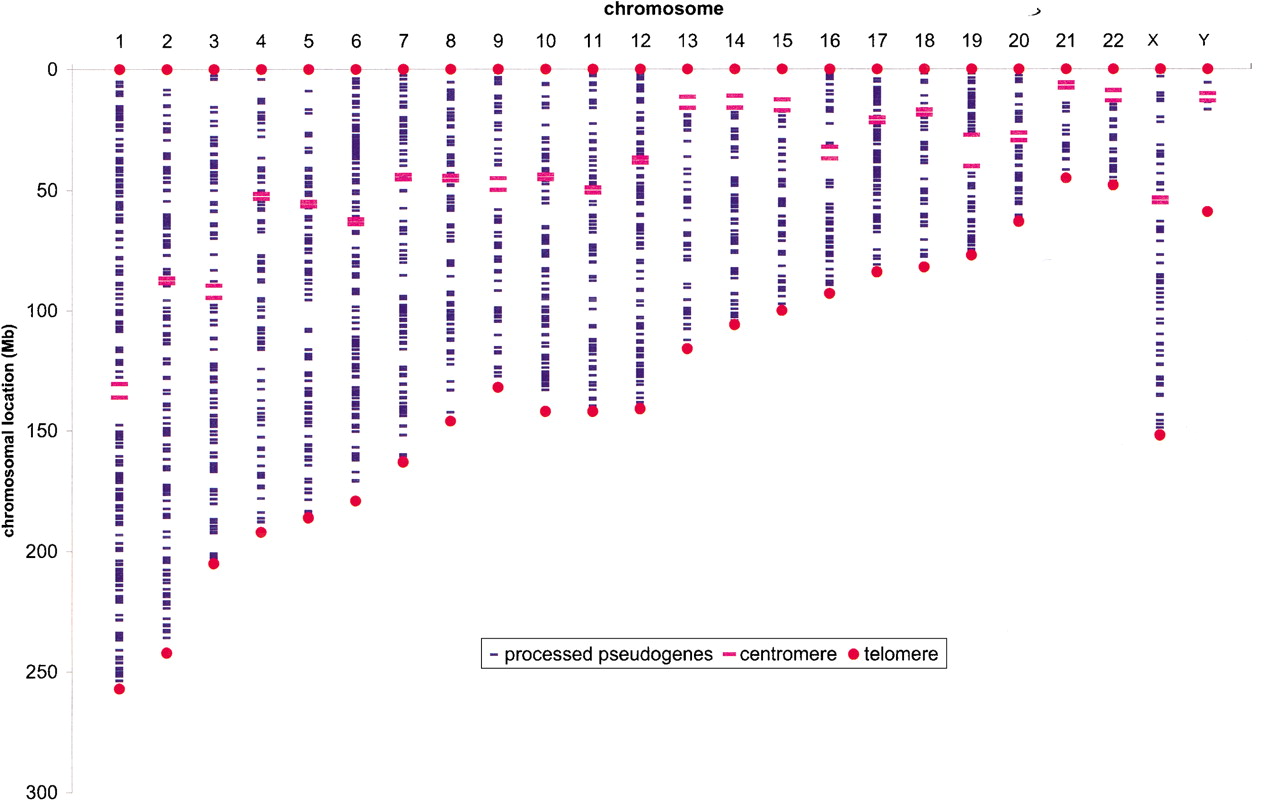
Figure 2.
The human RP processed pseudogene population. Twenty-four human chromosomes are shown vertically from left toright. Pseudogenes are represented as short blue horizontal bars; long thick red horizontal bars delimit centromere region. Red dots represent chromosome ends.


