
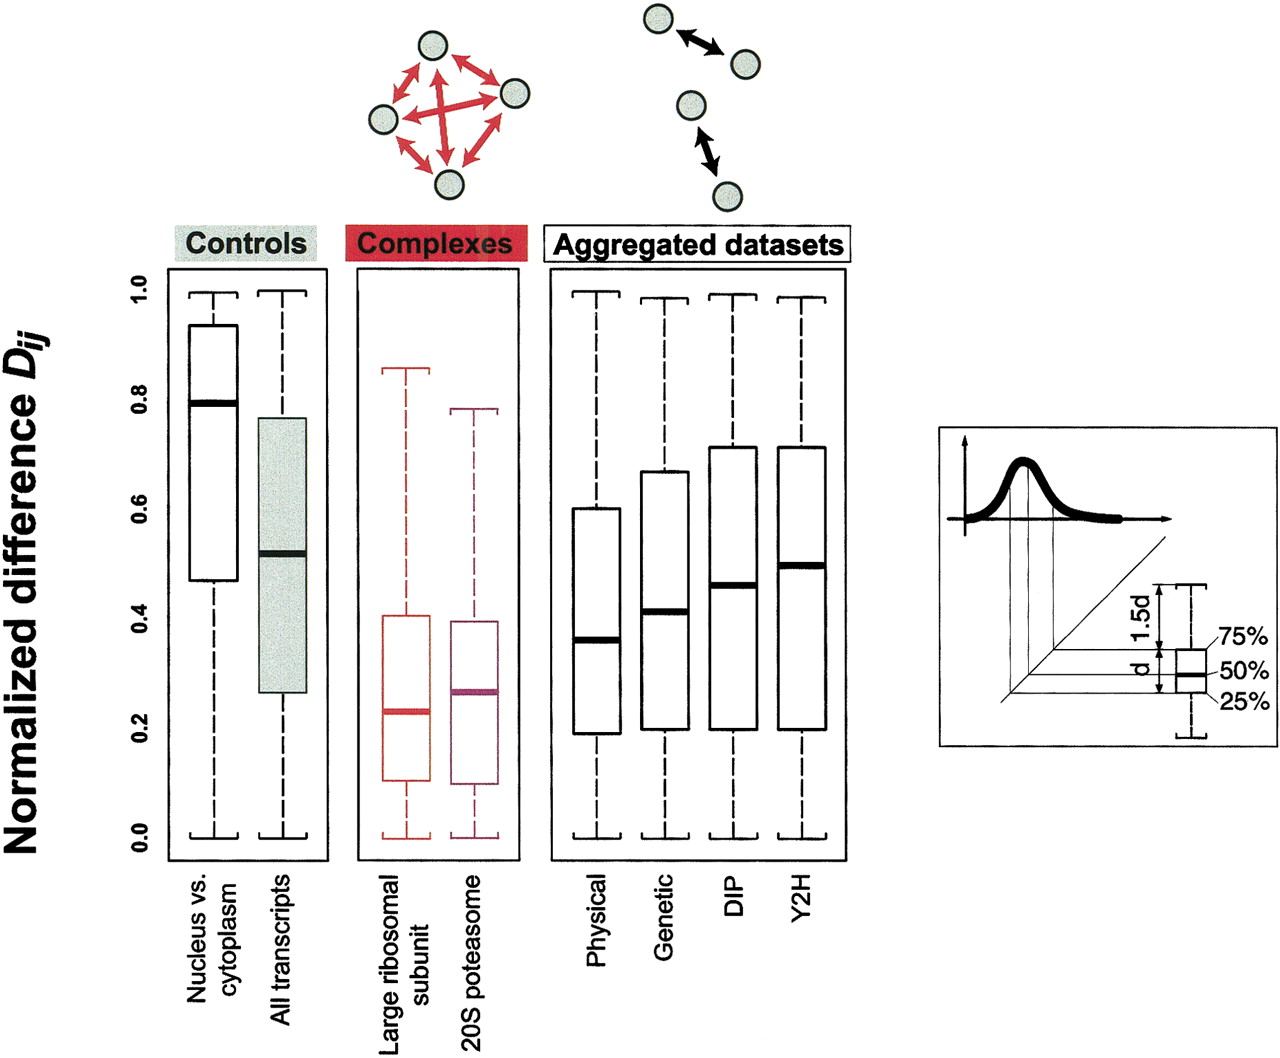
Distributions of normalized differences for various groups of proteins in boxplot representation. The normalized differenceDij is a measure of the relative similarity of two absolute gene expression levels Ei andEj . The middle panel shows the distribution for two protein complexes (the large ribosomal subunit and the 20S proteasome). Note that we considered all theoretically possible protein pairs within the protein complex (as indicated in the schematic drawing above the panel). The right panel shows the distribution for the aggregated data sets of protein-protein interactions (Y2H is yeast two-hybrid) (Bader and Hogue 2000; Cagney et al. 2000; Fellenberg et al. 2000; Ito et al. 2000; Schwikowski et al. 2000; Uetz et al. 2000; Uetz and Hughes 2000; Xenarios 2000; Ito et al. 2001). Unlike in the complexes, where we consider interactions among a whole group of proteins, the interactions in the aggregated data sets are specific to individual protein pairs (see schematic drawing). The left panel shows two control distributions of the normalized difference, on the left for pairs of nuclear and cytoplasmic proteins, which presumably, because of spatial separation, do not interact, and on the right for any random protein pair (“all transcripts”) in yeast. The distribution of nuclear versus cytoplasmic proteins is strongly skewed toward one (the maximum value of the normalized difference), which is partially explained by the fact that cytoplasmic proteins tend to have higher expression levels than cytoplasmic ones (Drawid 2000; Drawid and Gerstein 2000). The distribution of all transcripts is nearly uniform (with a median of 0.5) (see Methods). The complexes distributions are clearly skewed toward zero with medians between 0.2 and 0.3. The medians of the distributions of the aggregated data sets are still somewhat smaller than the control median, most notably for the physical interactions data set; on the other hand, there is virtually no difference between the control and the distribution of the yeast two-hybrid data set.
The aggregated data, obviously, includes some interactions implied by the complexes, with the degree of intersection ranging from 35% for the physical interactions to ∼6% for Y2H.


