
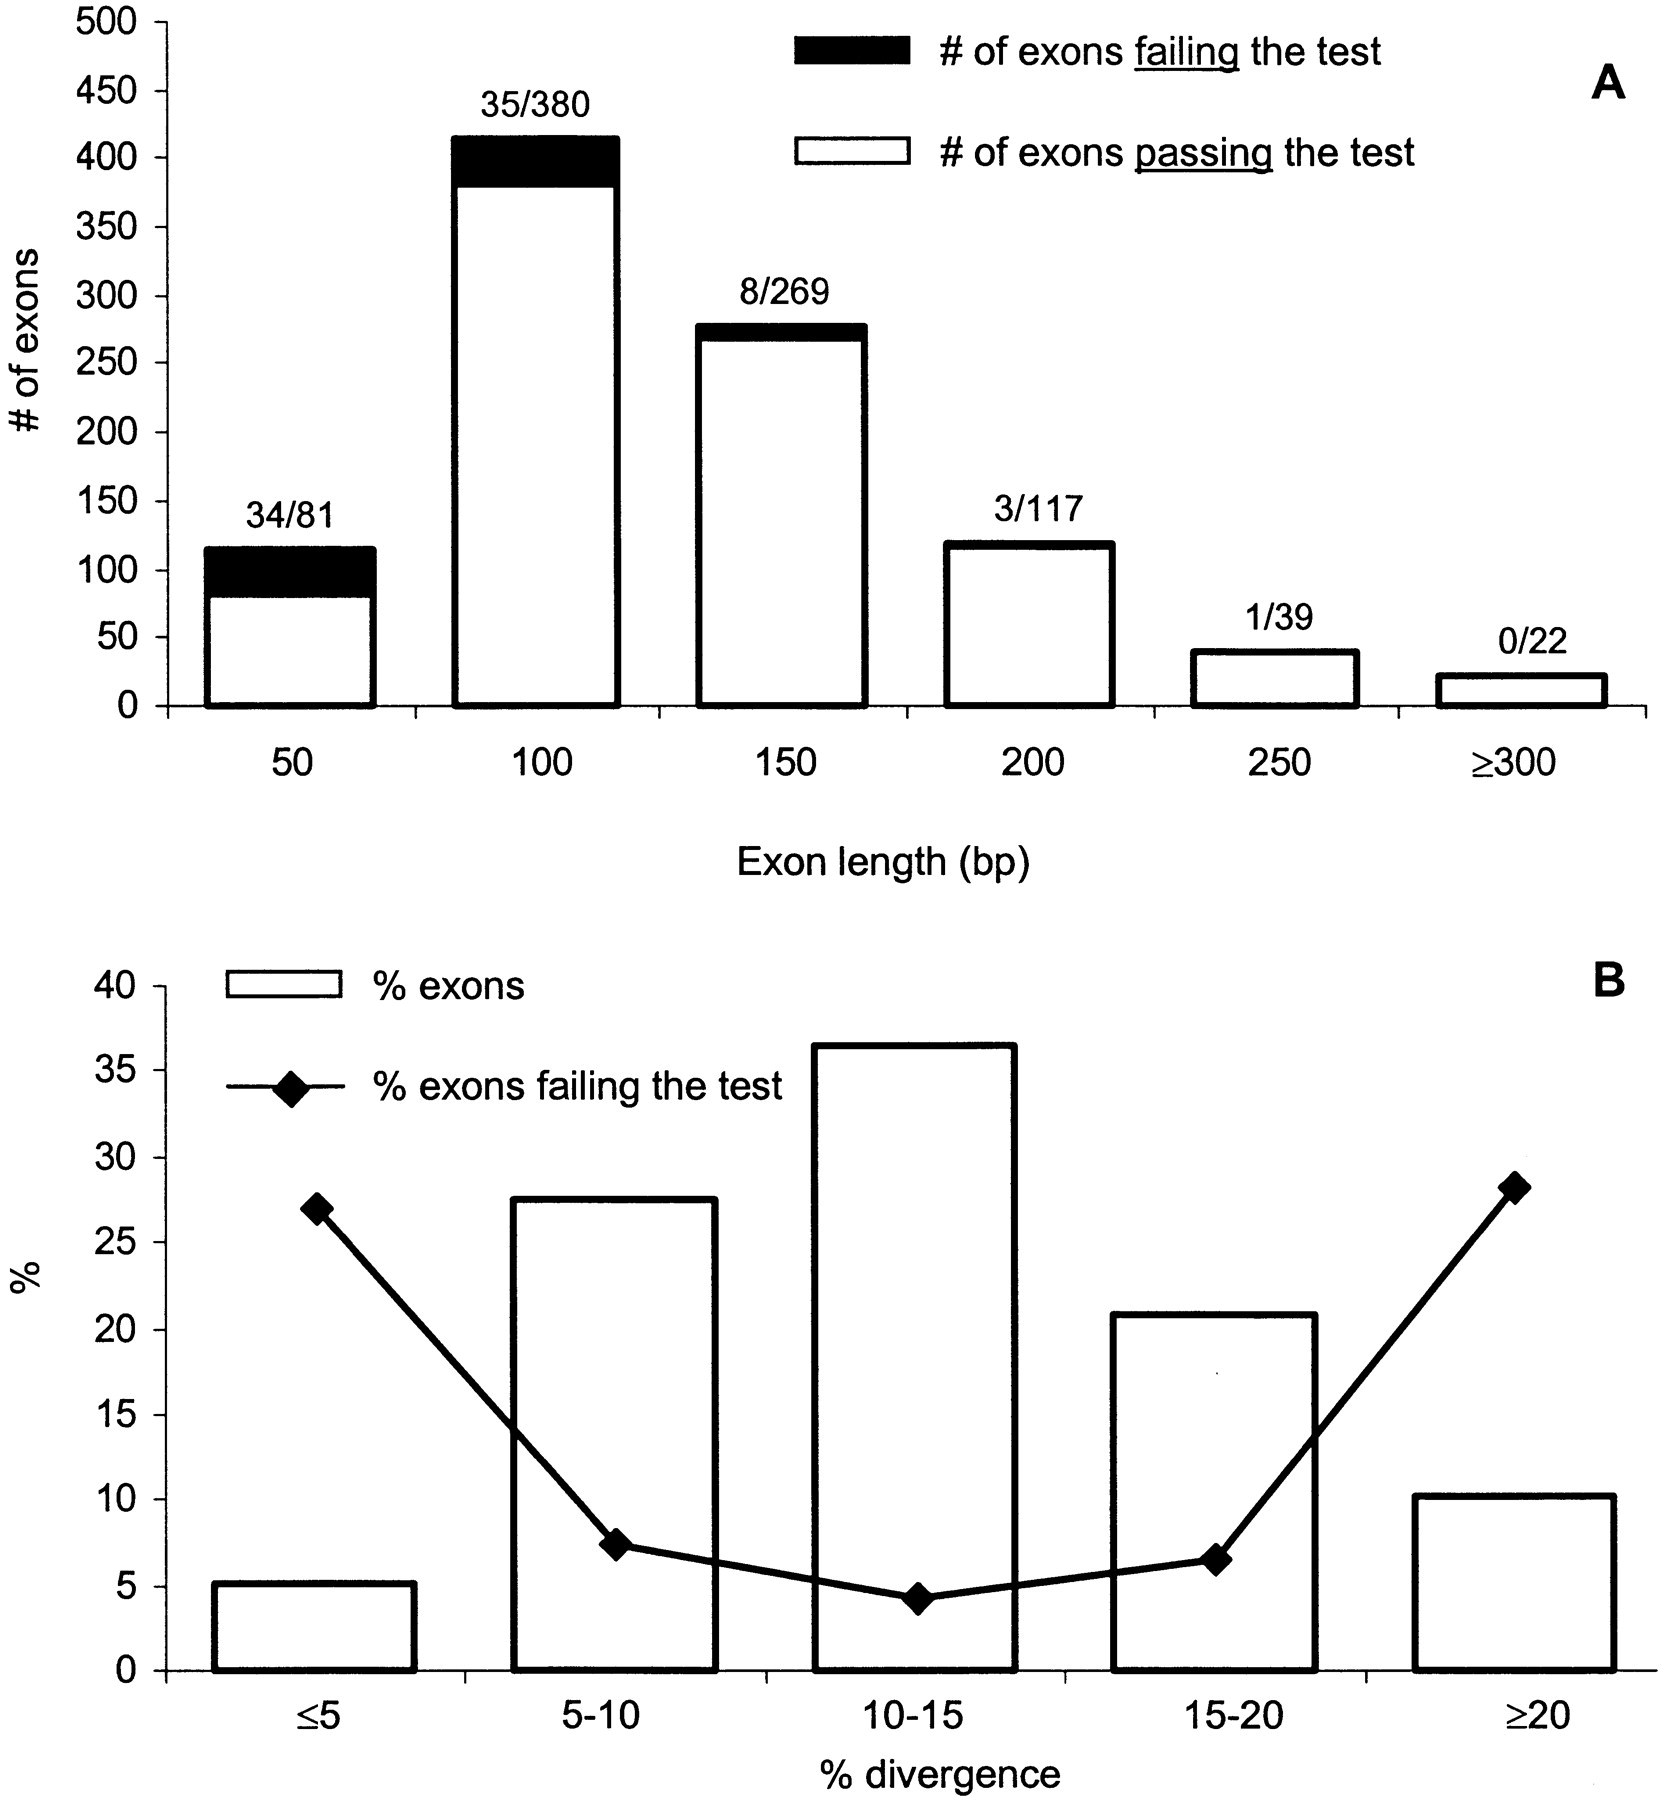
(A) Distribution of exon lengths. Exons were stratified into six length classes. For example, the 100-bp class contains exons with lengths ranging from 75 to 125 bp. The white area of each bar represents the number of exons that showK A/K S significantly smaller than 1 (passing the test), whereas the shaded area corresponds to the number of exons that have K A/K S not statistically different from 1 (failing the test). The numbers above each bar indicates the ratio of the number of exons in the shaded area to the number of exons in the white area. For example, the group with the mean length 50 bp contains 81 exons; 34 of them did not pass theK A/K S test. (B) Relationship between human–mouse sequence divergence and the number of false negatives (exons that fail the test). Bars represent the proportions of exons in each of the five divergence classes. Points on the curve indicate the proportion of false negatives within each identity class. For example, ∼35% of exons in our dataset belong to a class in which divergence ranges from 10% to 15%. Within this class ,∼4% exons did not pass theK A/K S test.


