
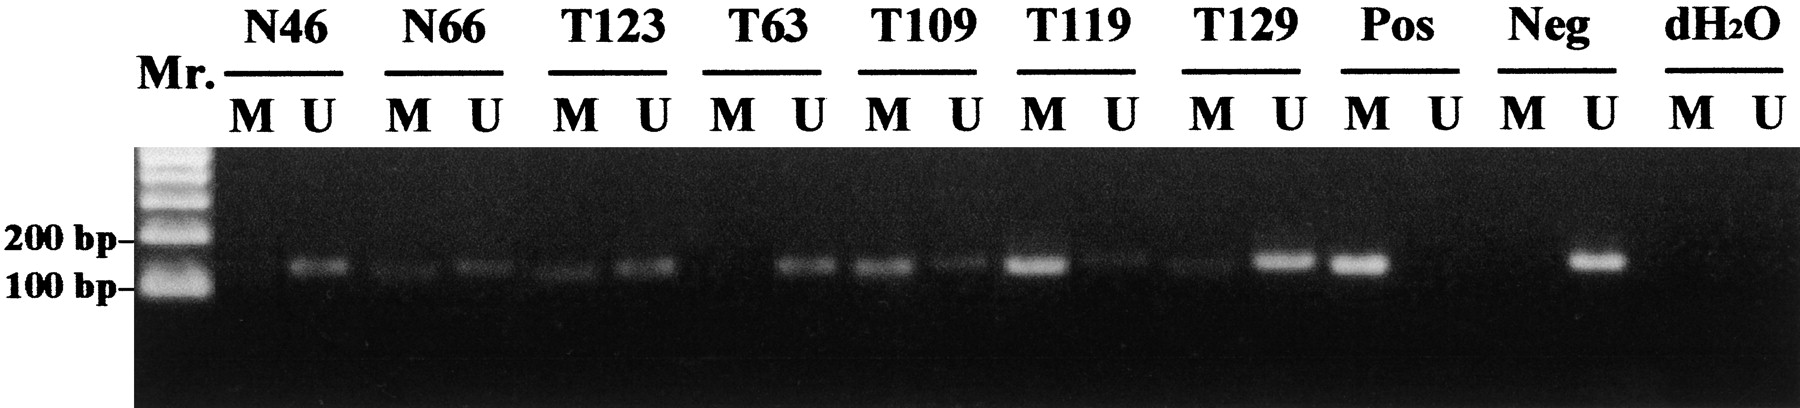
Figure 6.
MS–PCR analysis of the ERα CpG#7–11 in primary breast tumors (T) and normal breast tissue (N). M and U indicate amplification using methylated and unmethylated sequence-specific primers, respectively. (Pos) Positive control; (Neg) negative control.


