
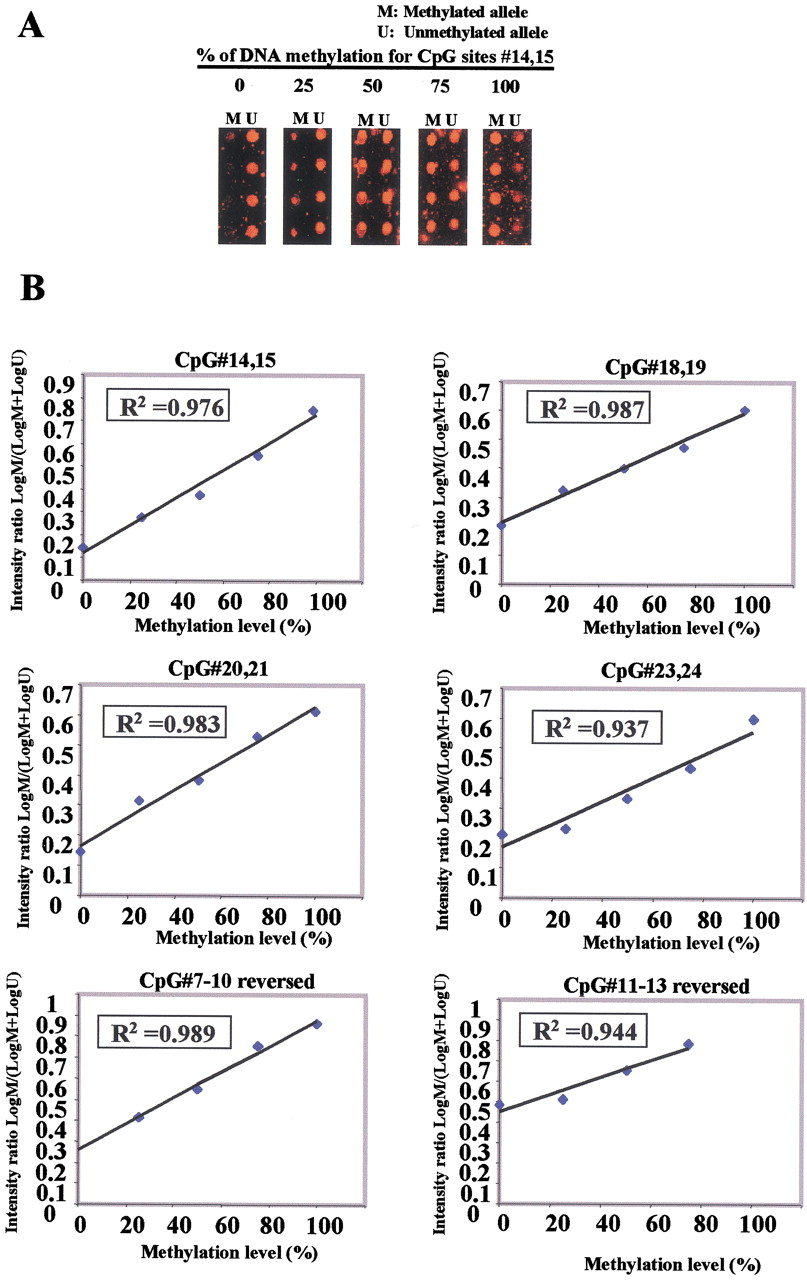
Standardization curve for MSO assays. (A) Mixtures of in vitro-methylated and untreated control DNA were prepared and amplified by PCR using bisulfite primers for the human ERα CpG island (see Methods). Target DNA was hybridized to MSO microarray. The Cy5 red fluorescence signals of the methylated (M) and unmethylated (U) alleles for CpG#14,15 are shown, reflecting the indicated percentage of methylation. (B) A calibration curve for measuring methylation changes at the ERα CpG sites. The intensity ratios (Y-axis) represent signal intensities of log M/log M+log U. The linear distribution shows that measurements of the different mixtures are well distinguished and can be used to determine the methylation status for test samples. The MSO assays were independently repeated three times with different target preparations.


