
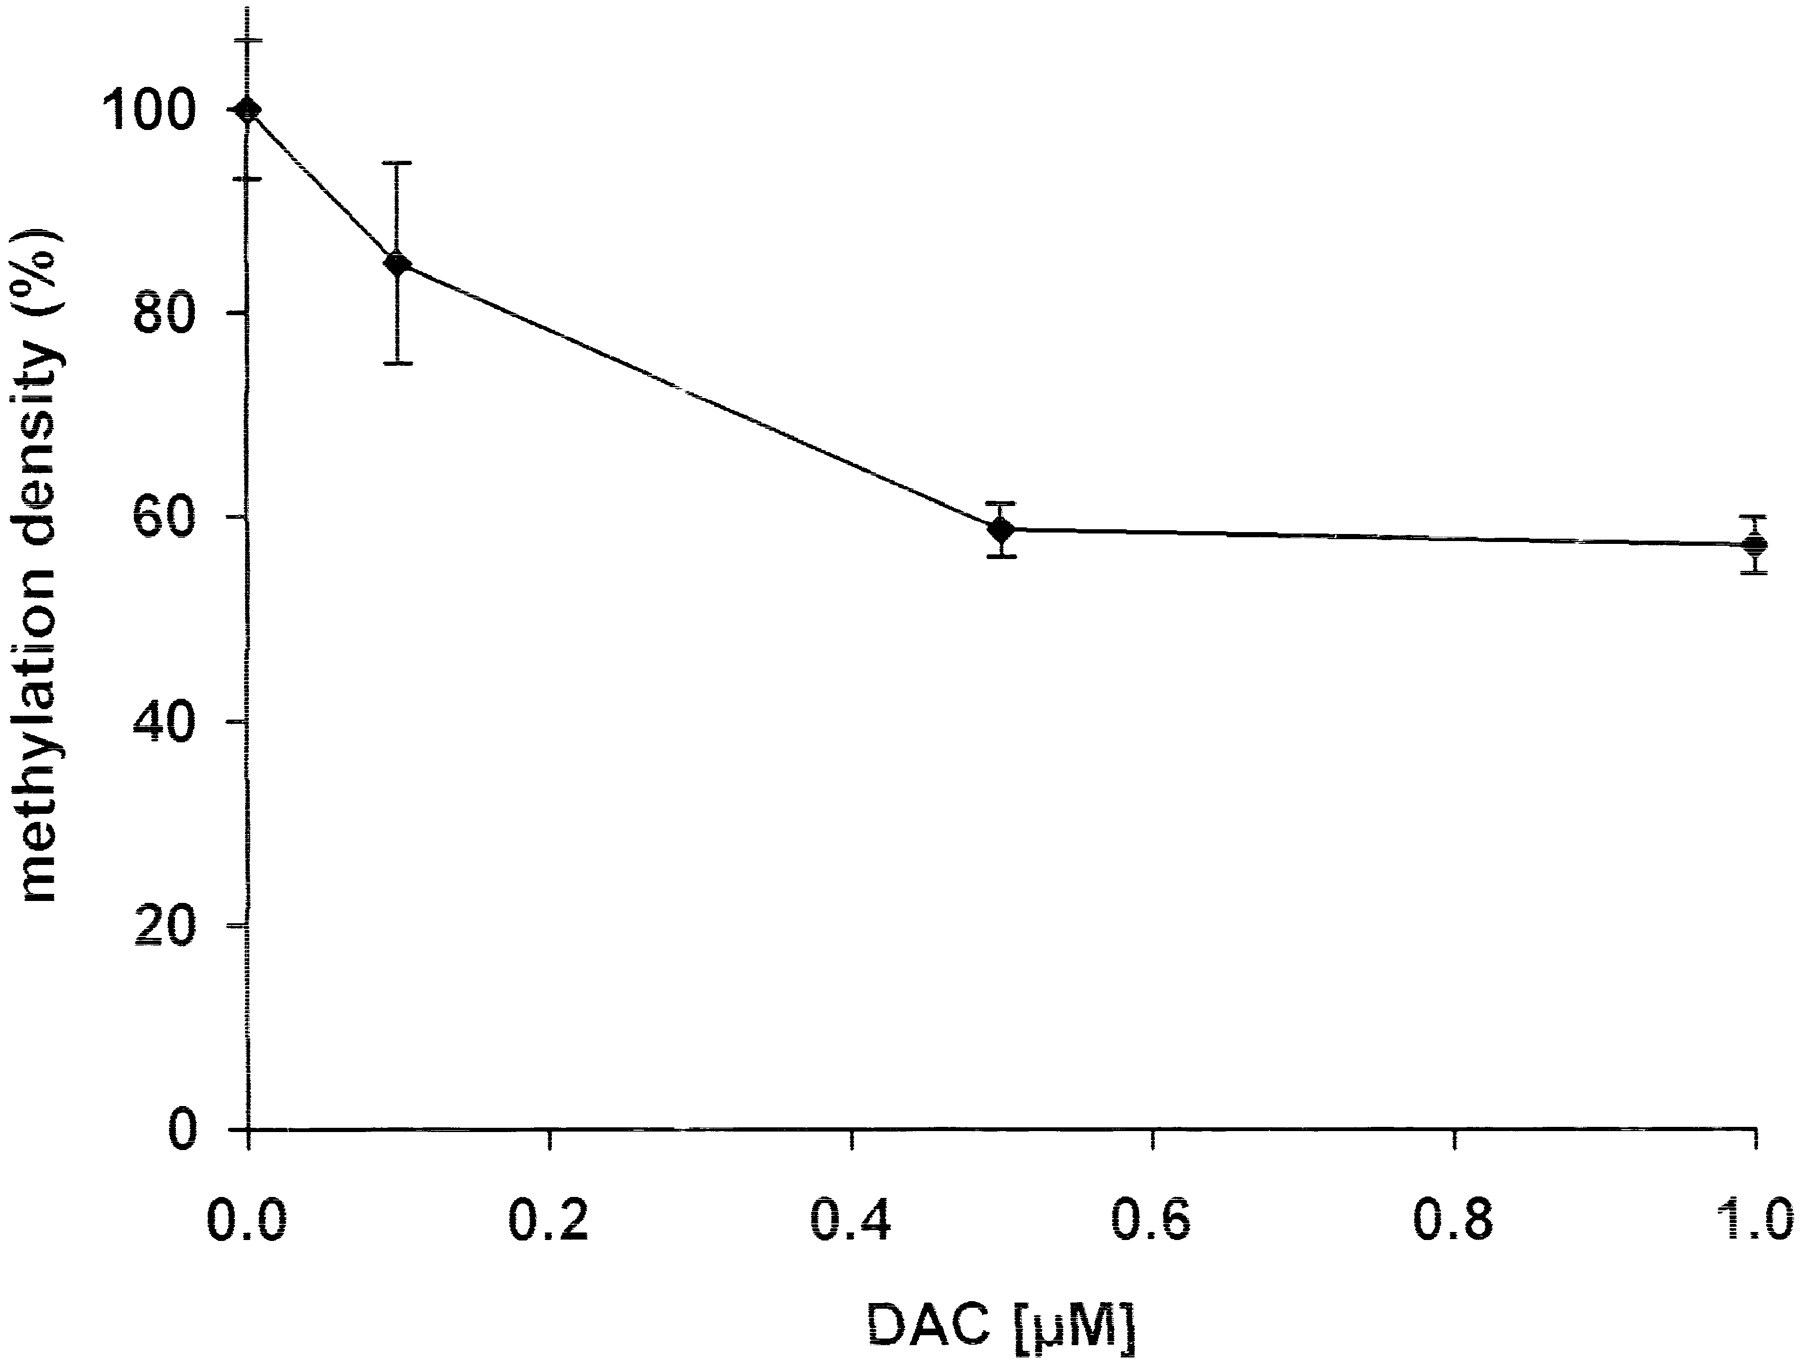
Figure 5.
Influence of DAC treatment for 72 h on p15INK4B promoter methylation density in KG1a cells. Results are expressed as the mean value ± SD of triplicates.
(Downloading may take up to 30 seconds. If the slide opens in your browser, select File -> Save As to save it.)
Click on image to view larger version.
Influence of DAC treatment for 72 h on p15INK4B promoter methylation density in KG1a cells. Results are expressed as the mean value ± SD of triplicates.
 CiteULike
 Delicious
 Digg
Digg Facebook
 Google+
 Reddit
 Twitter
