
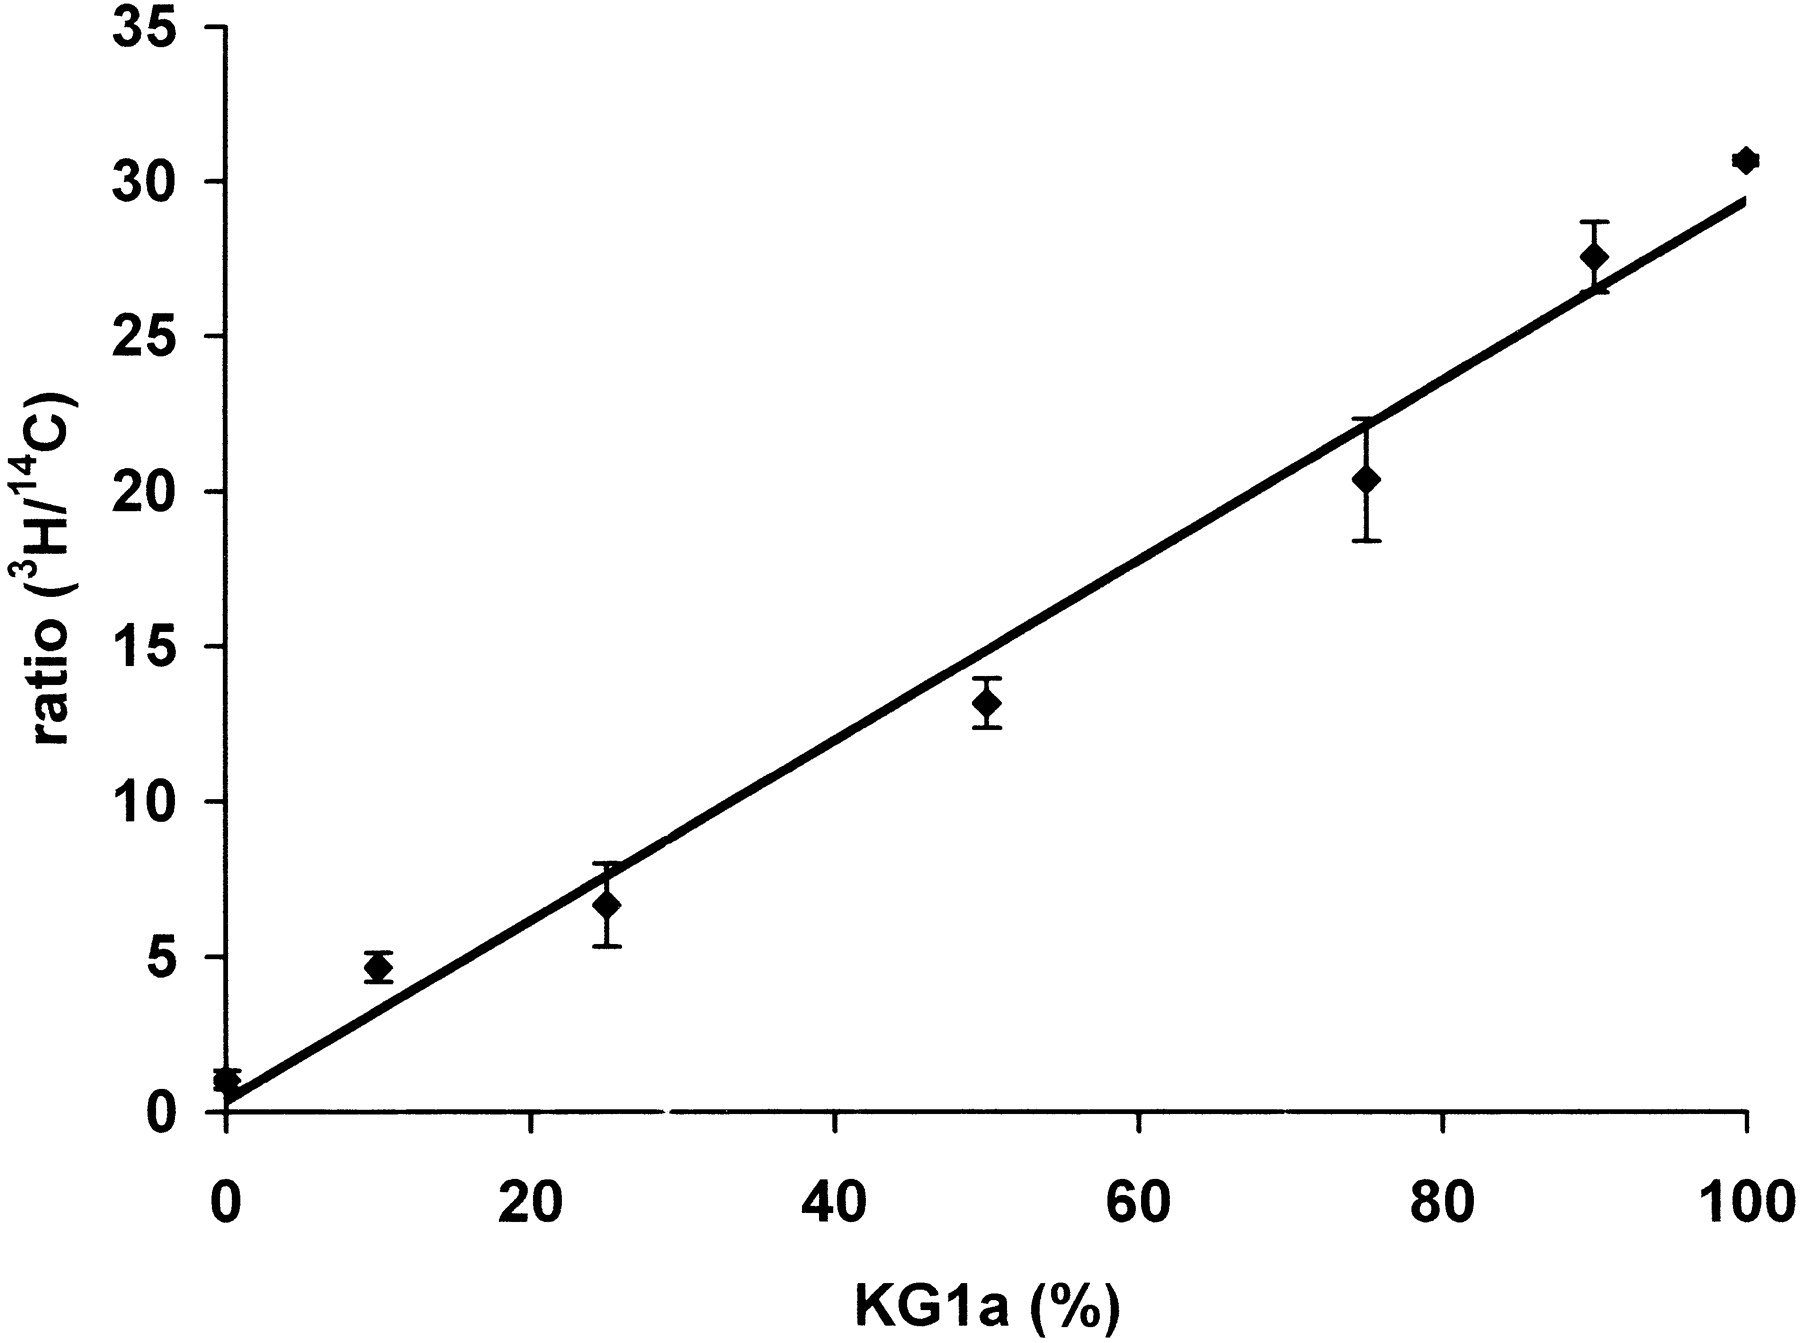
Figure 2.
Mixing experiments using DNA form the cell lines KG1a and HL60. The ratio (3H/14C signal) is plotted against the percentage of KG1a DNA in the mixtures. The graph shows a linear relation between p15INK4B promoter methylation density and the ratio (3H/14C signal). Results are expressed as the mean value ± SD of triplicates (correlation coefficient = 0.99).


