
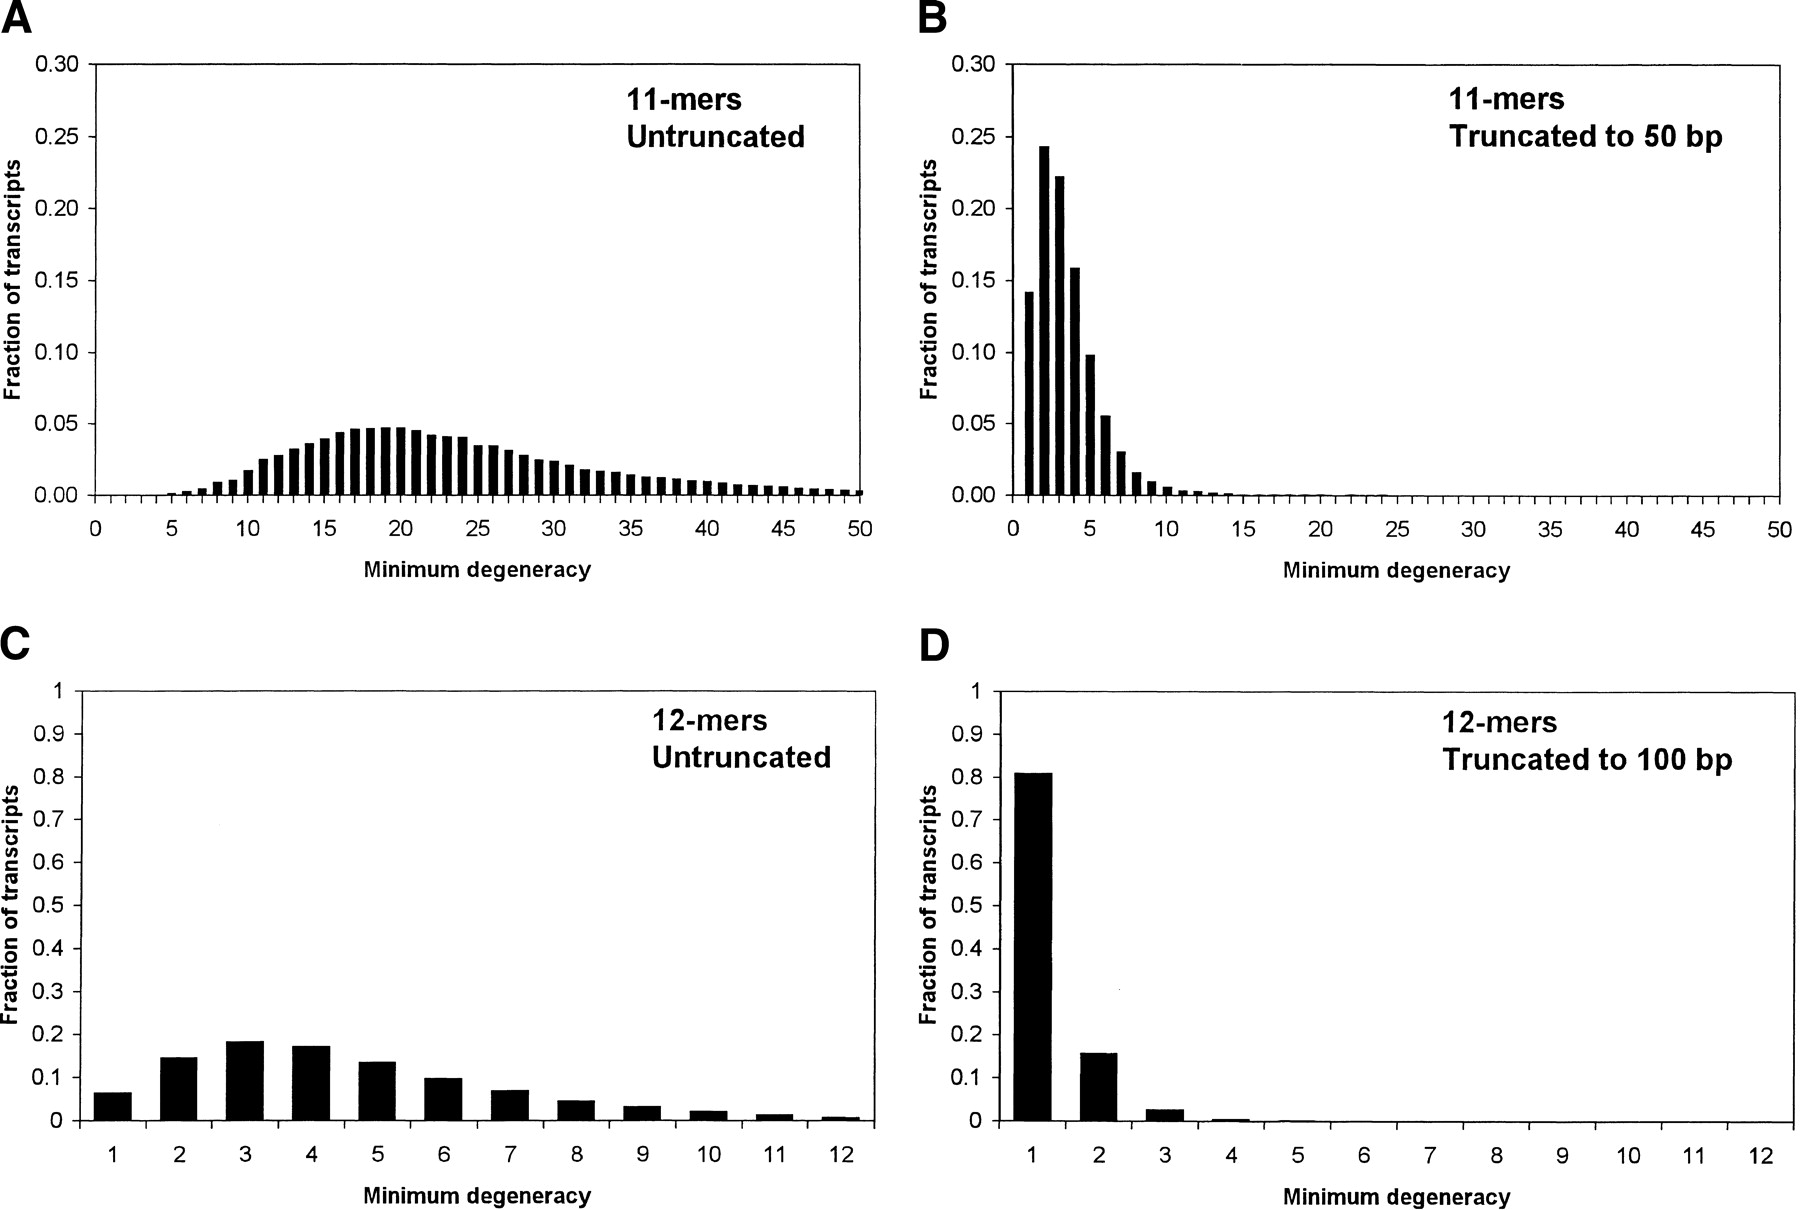
Figure 3.
Minimum degeneracy histograms for mouse assuming 1 mismatch. (A) 11-mers, no truncation; (B) 11-mers, truncation to 50 bp; (C) 12-mers, no truncation; (D) 12-mers, truncation to 100 bp. Each histogram shows the fraction of transcripts having a given minimum degeneracy value. Histograms were generated by custom computer software that examined actual sequence data to find the n-mer with lowest degeneracy that binds to each transcript (allowing up to 1 mismatch). As expected, increasing n and decreasing transcript length both increase the proportion of genes having low minimum degeneracy.


