
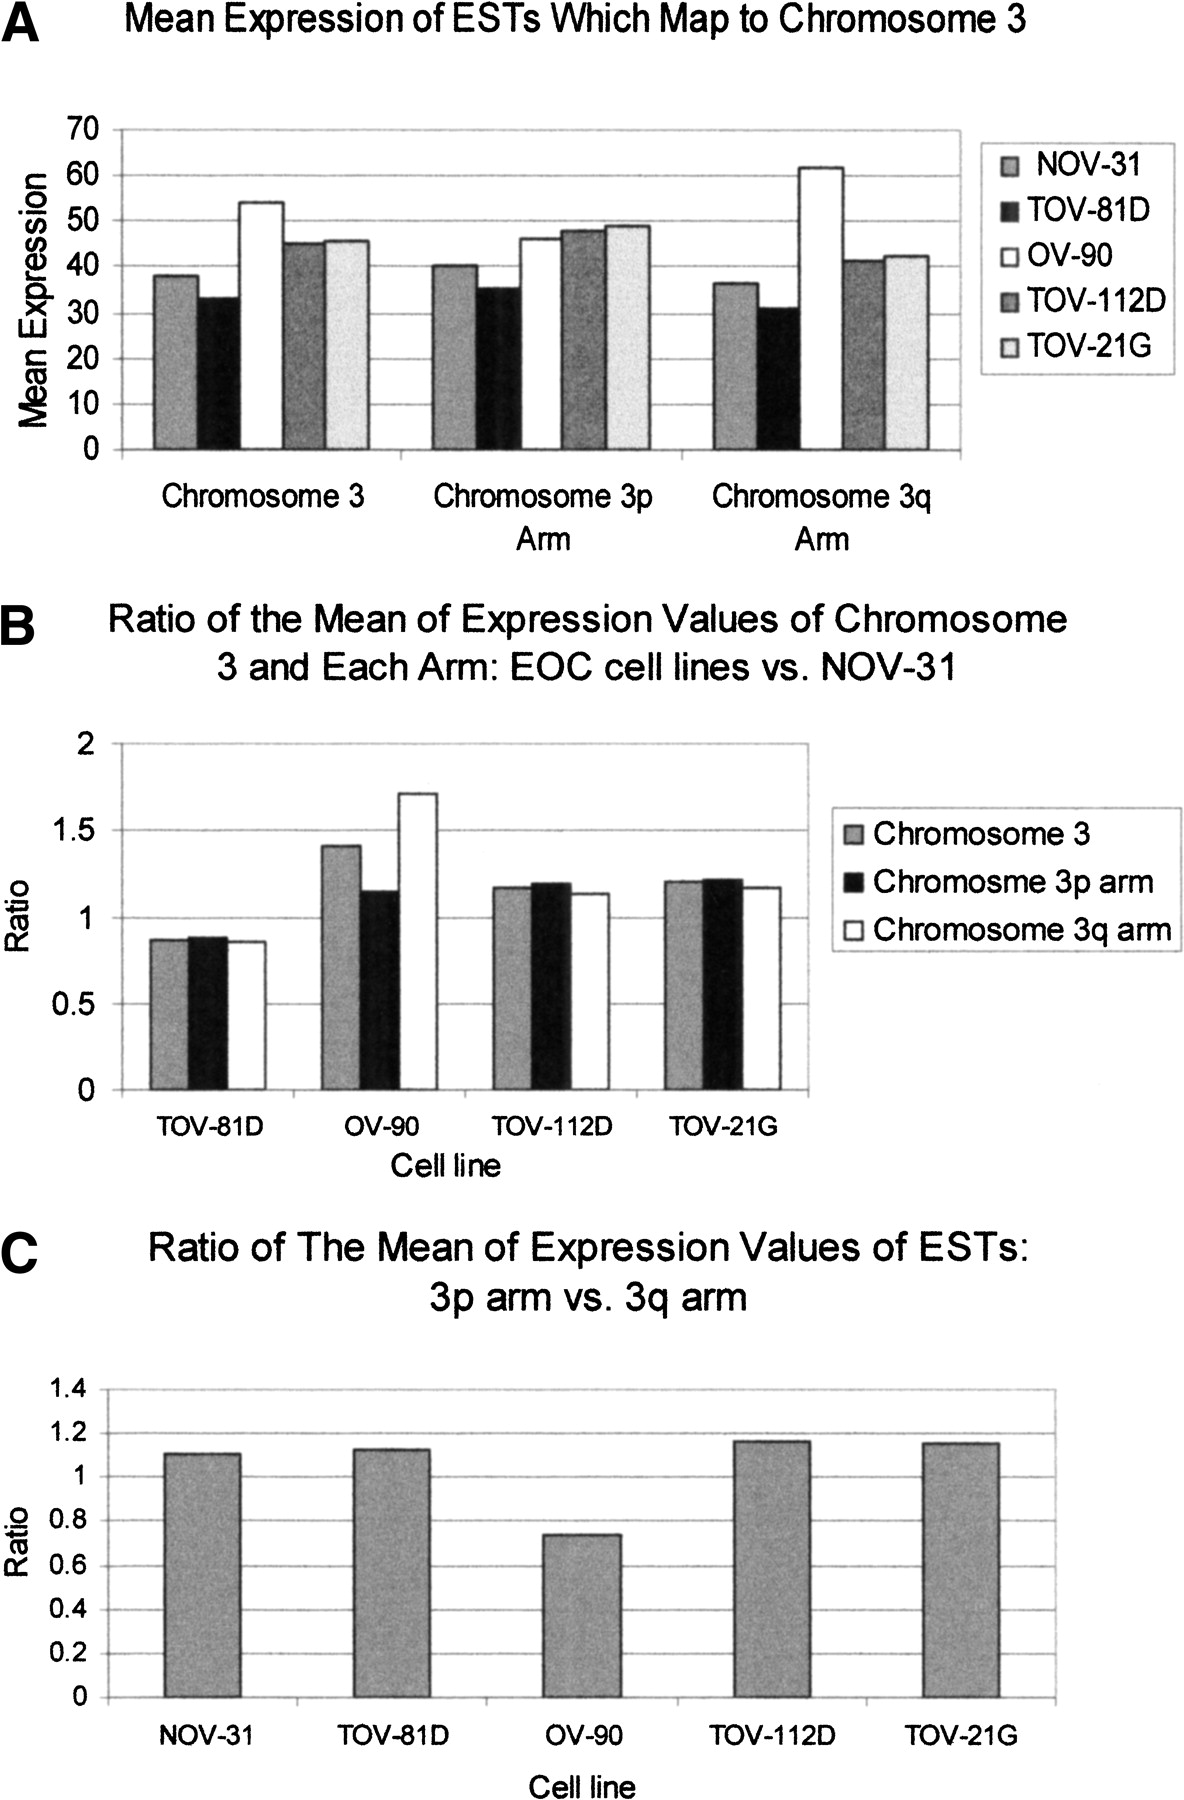
Analysis of the mean of the expression values of chromosome 3 mapped ESTs. The mean was calculated by adding the expression values of all ESTs and dividing by the total number of ESTs for each sample. (A) The mean of the expression values of ESTs that mapped to the entire chromosome 3 and each arm separately was calculated for NOV-31 and the four EOC cell lines. (B) A comparison was made between NOV-31 and the EOC cell lines by dividing the mean of the expression values for each cell line by the mean of the expression values for NOV-31. (C) The results of comparisons of the mean of the expression values of ESTs that map to the 3p arm to the mean of the expression values of ESTs that map to the 3q arm. The ratio was calculated by dividing the mean of the expression values of ESTs that mapped to the 3p arm by that of the 3q arm for each sample.


