
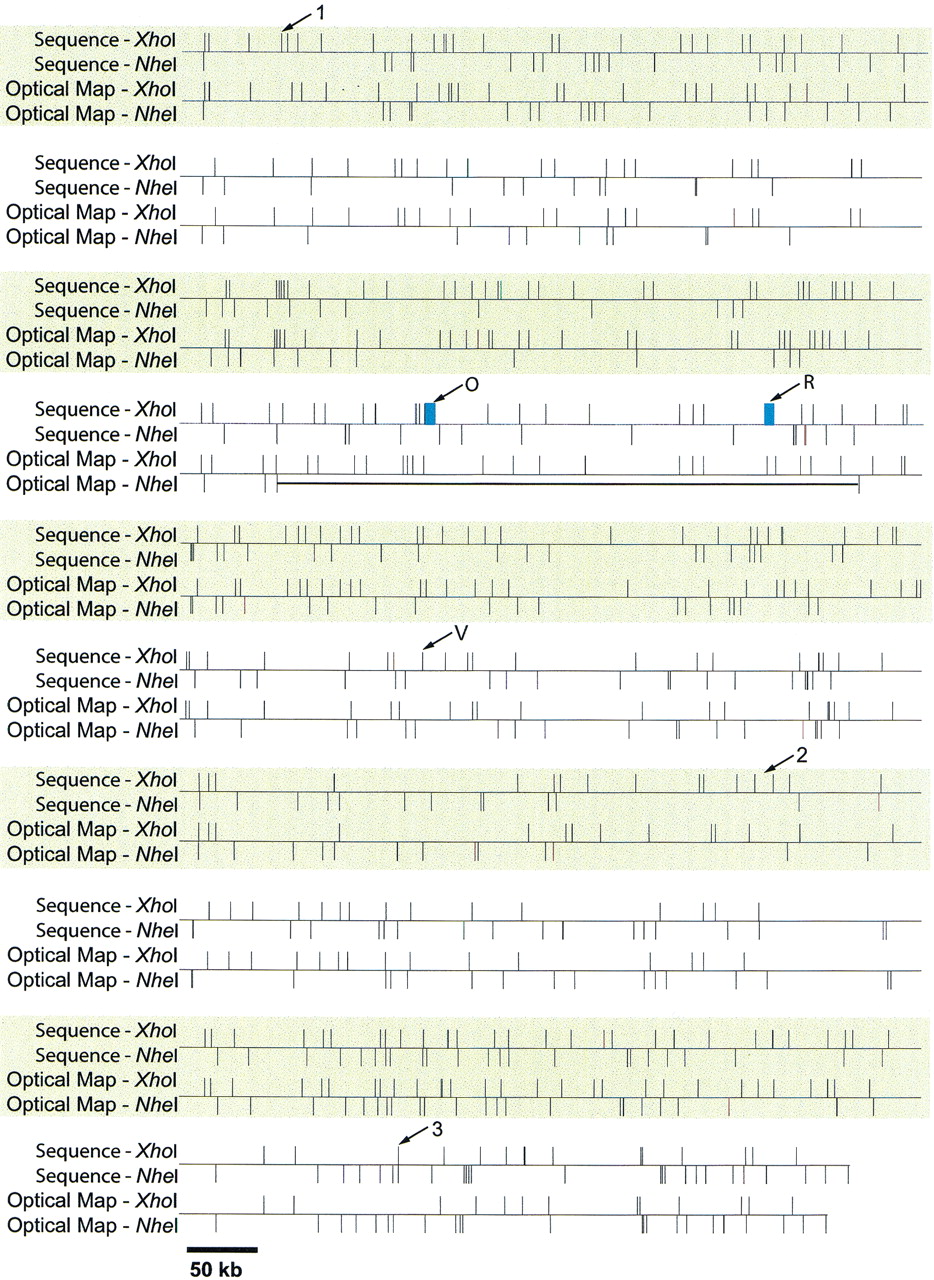
Figure 4.
Alignment of map and sequence data. The use of sequence information to link single-enzyme optical maps. The composite optical map was generated by normalizing the single-enzyme maps to be the same size. The resulting multienzyme map was aligned with the map predicted from sequence. The thick black horizontal line denotes a missing region in the NheI optical map. The arrows show discrepancies between sequence and the optical maps. These discrepancies correspond to those in Figure 2b. The blue rectangles denote gaps in the sequence data compared to the XhoI optical map.


