
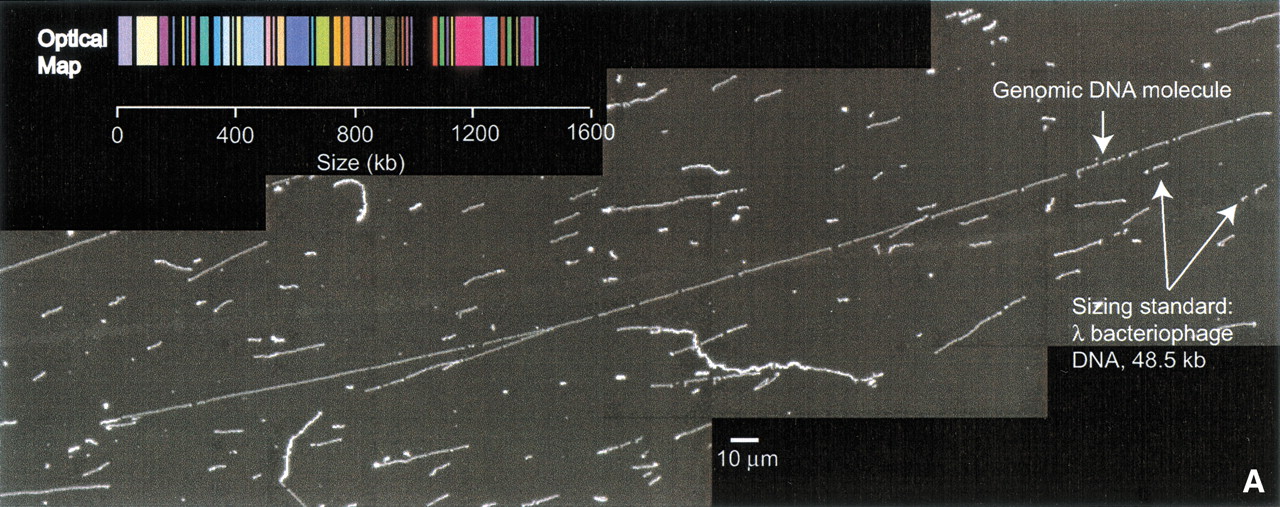

(a) Digital fluorescence micrograph and map of a typical genomic DNA molecule. An E. coli O157:H7 molecule digested with XhoI is shown with its corresponding optical map. Image was constructed by tiling a series of 63× (objective power) images using GenCol. Comounted λ bacteriophage DNA was used as a sizing standard and to estimate enzymatic cutting efficiencies. (b) Whole genome XhoI restriction map of E. coli O157 generated by shotgun optical mapping. The outercircle represents an in silico XhoI digest of the sequence. The second outermost circle shows the consensus optical map. The inner circles represent the individual molecule maps from which the consensus map was generated. XhoI fragment sizes (in kilobases) can be measured from the figure. Colors are arbitrarily assigned to homologous overlapping fragments. The white triangles show discrepancies between the sequence and the optical map. These regions are detailed in Table 1.


