
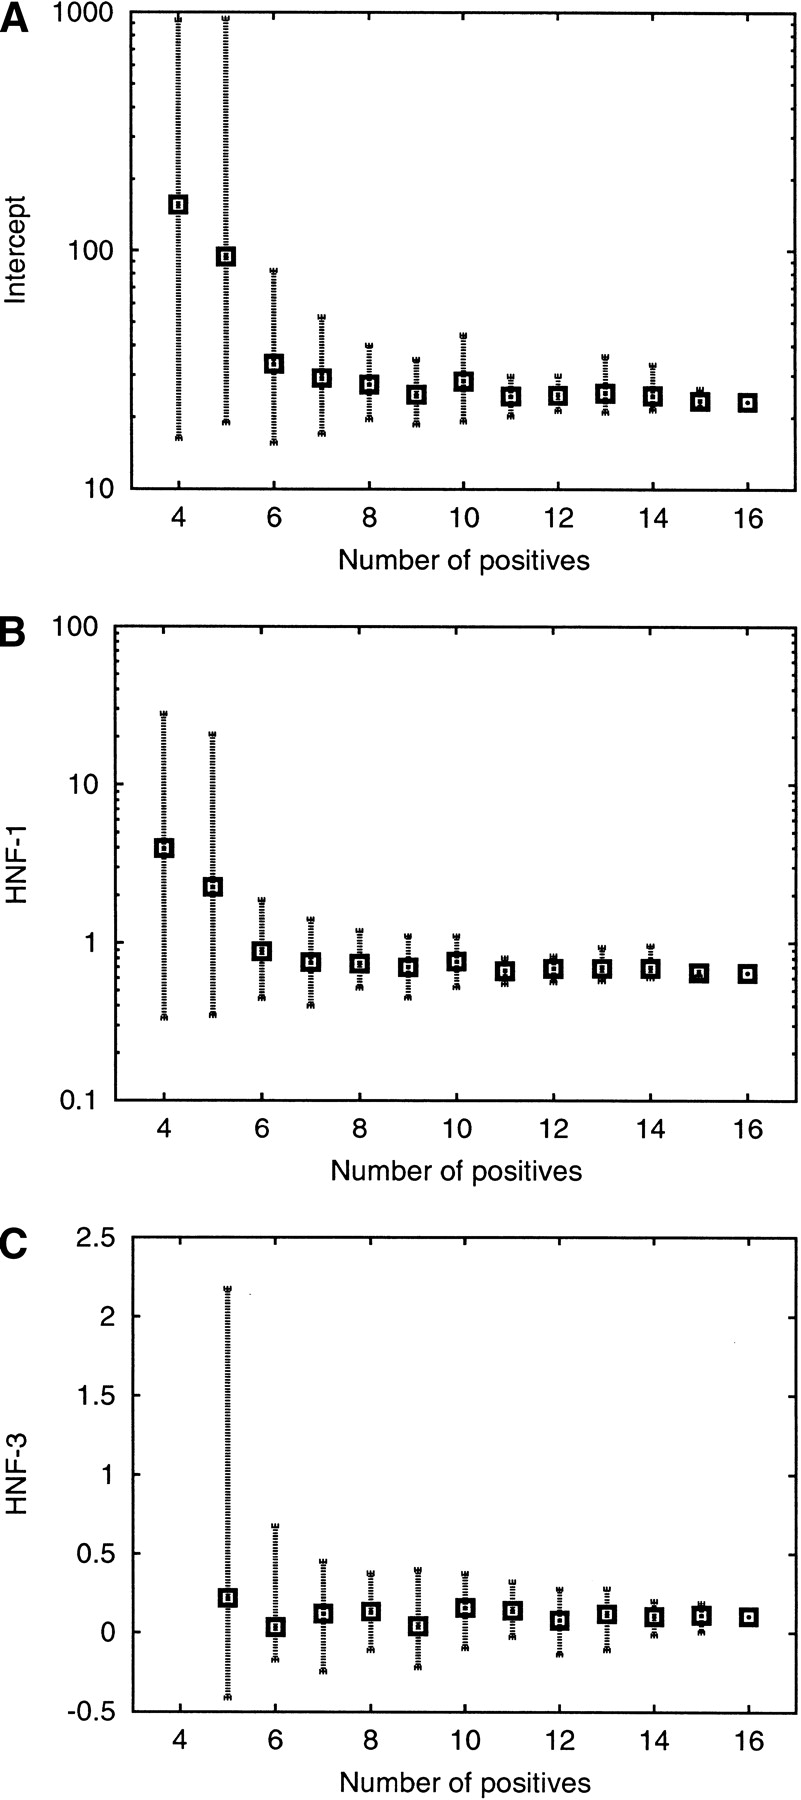
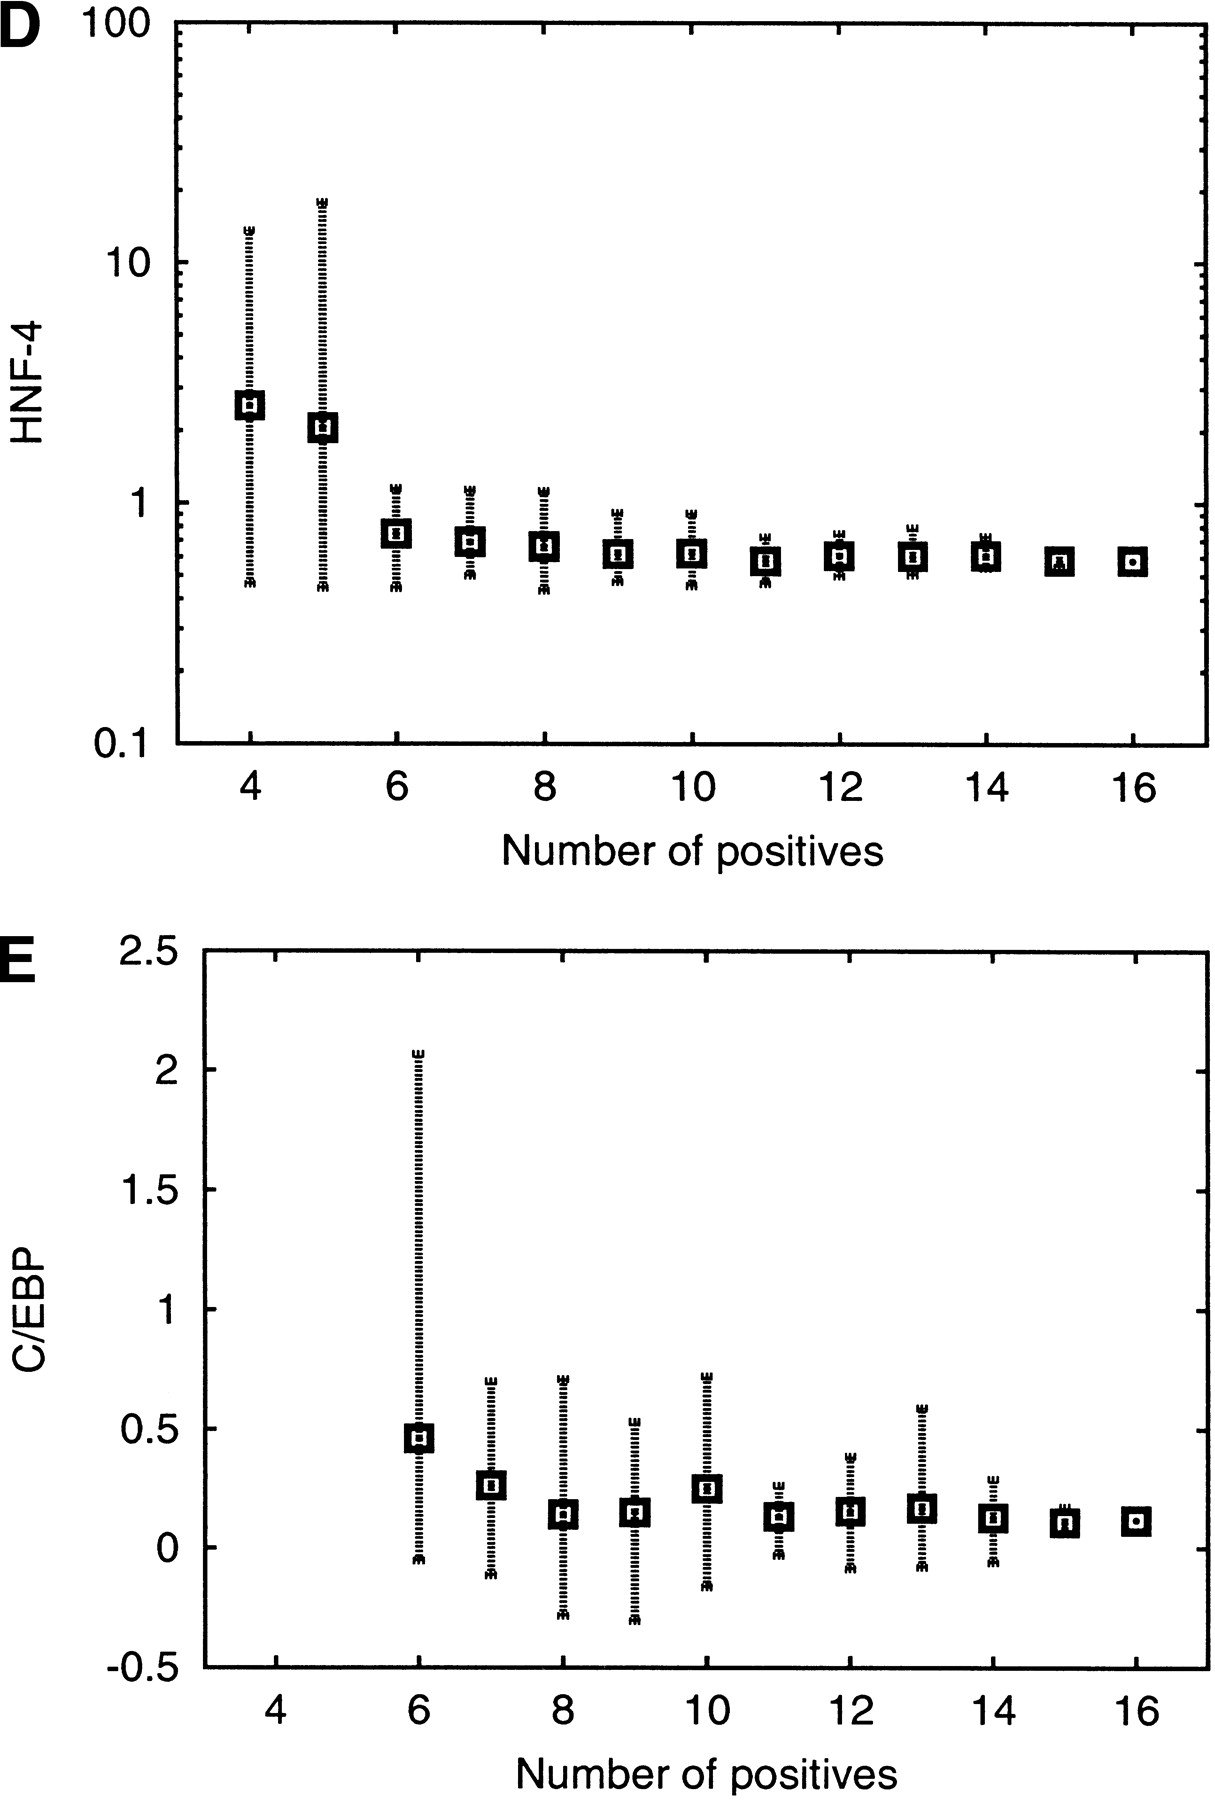
Figure 3.
Dependence of the numerical values of the LRA coefficients on the number of included positive training sequences. Between 4 and 15 randomly selected positive training sequences were used for the computation of the LRA coefficients. The bars depict the maximum, minimum, and average coefficient values from 15 trials.


