
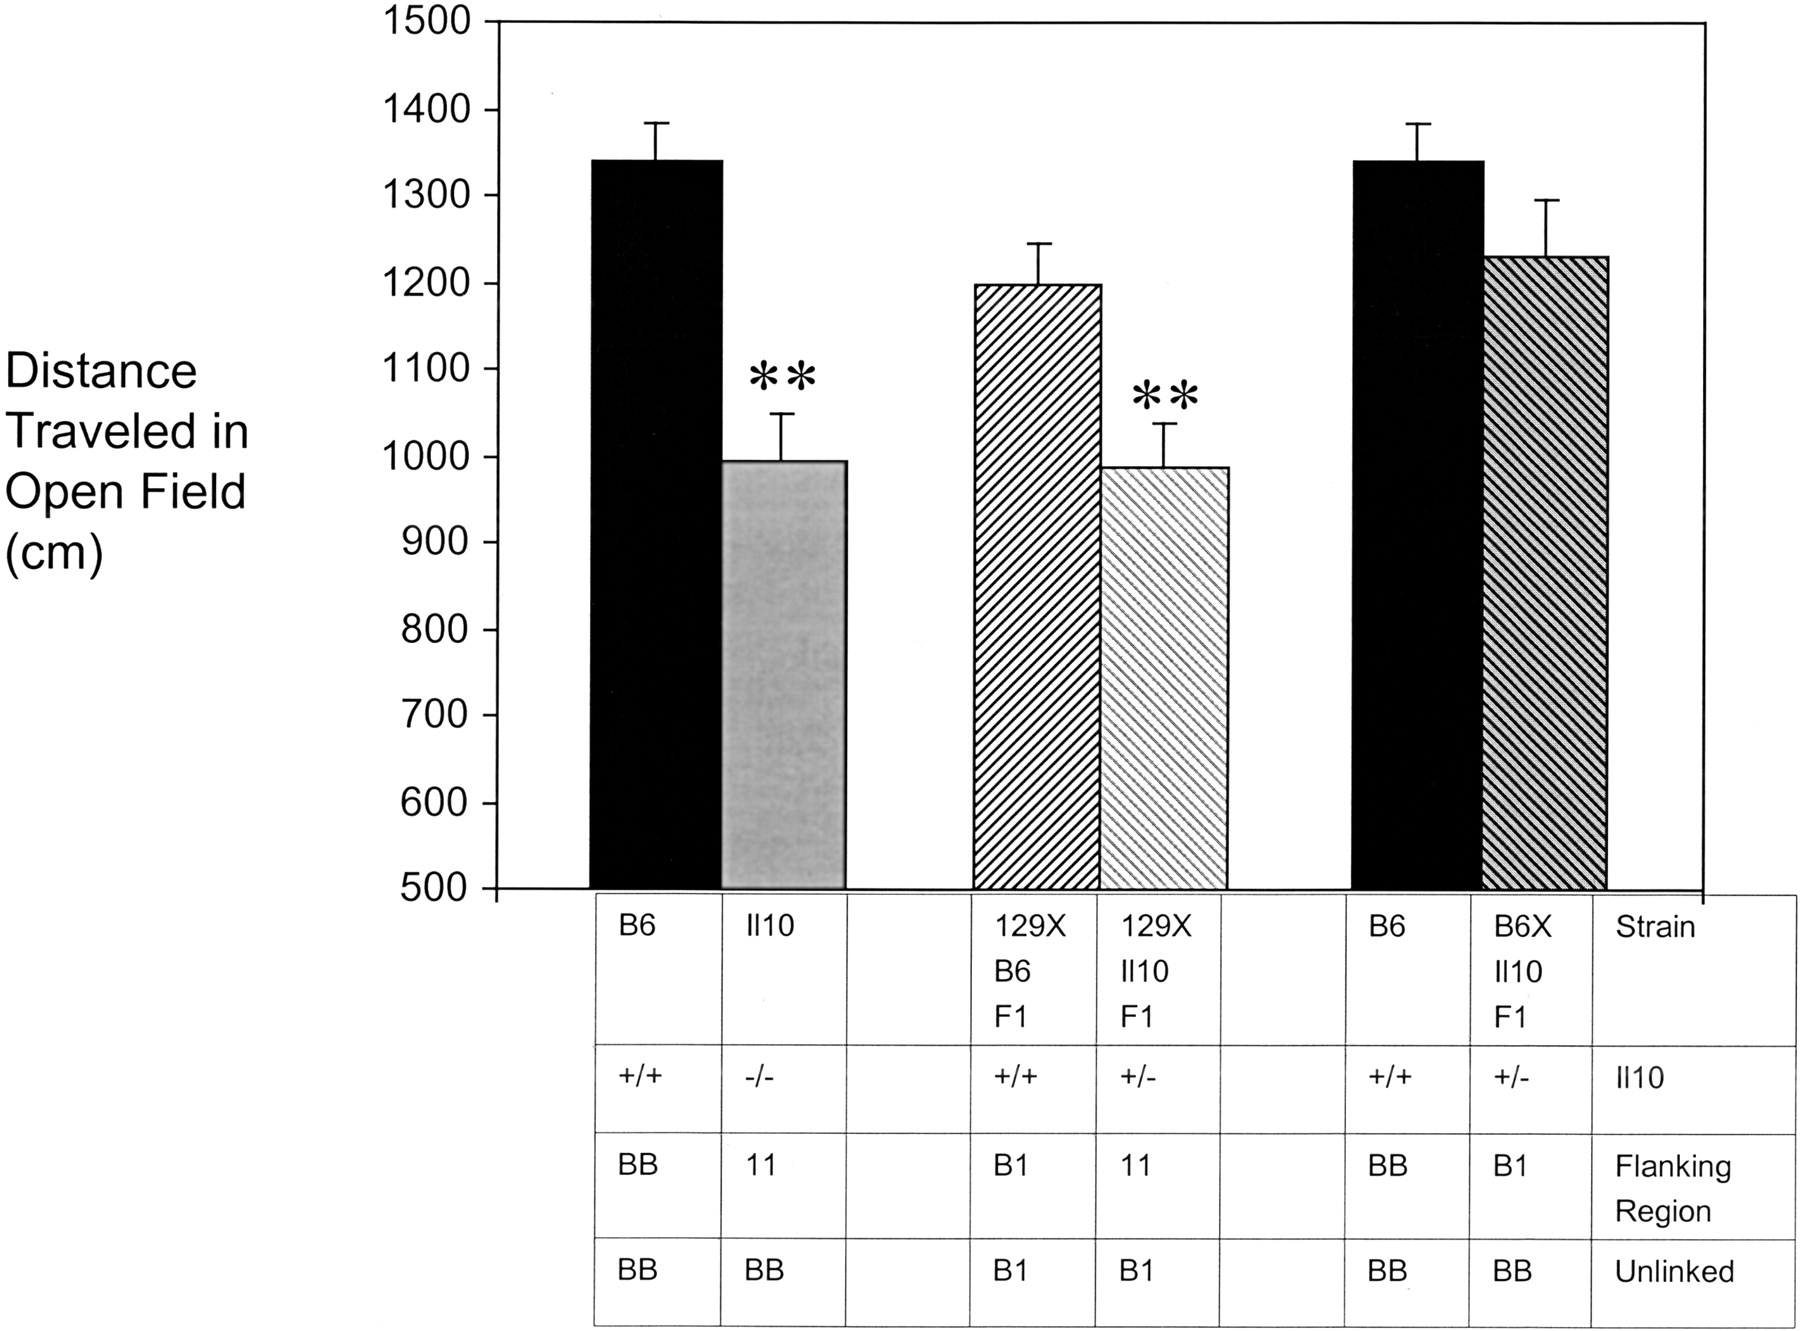
Figure 3.
Open field performance of F1 and knockout/congenic mice. Twenty-four male mice of each strain were tested. Results are shown + s.e.m. There was a significant effect of strain (F4,115 = 7.733,P<.001). Fisher's posthoc tests were then used to make pairwise comparisons. Double asterisks indicate P<0.01 in ANOVA analysis using STATVIEW.


