
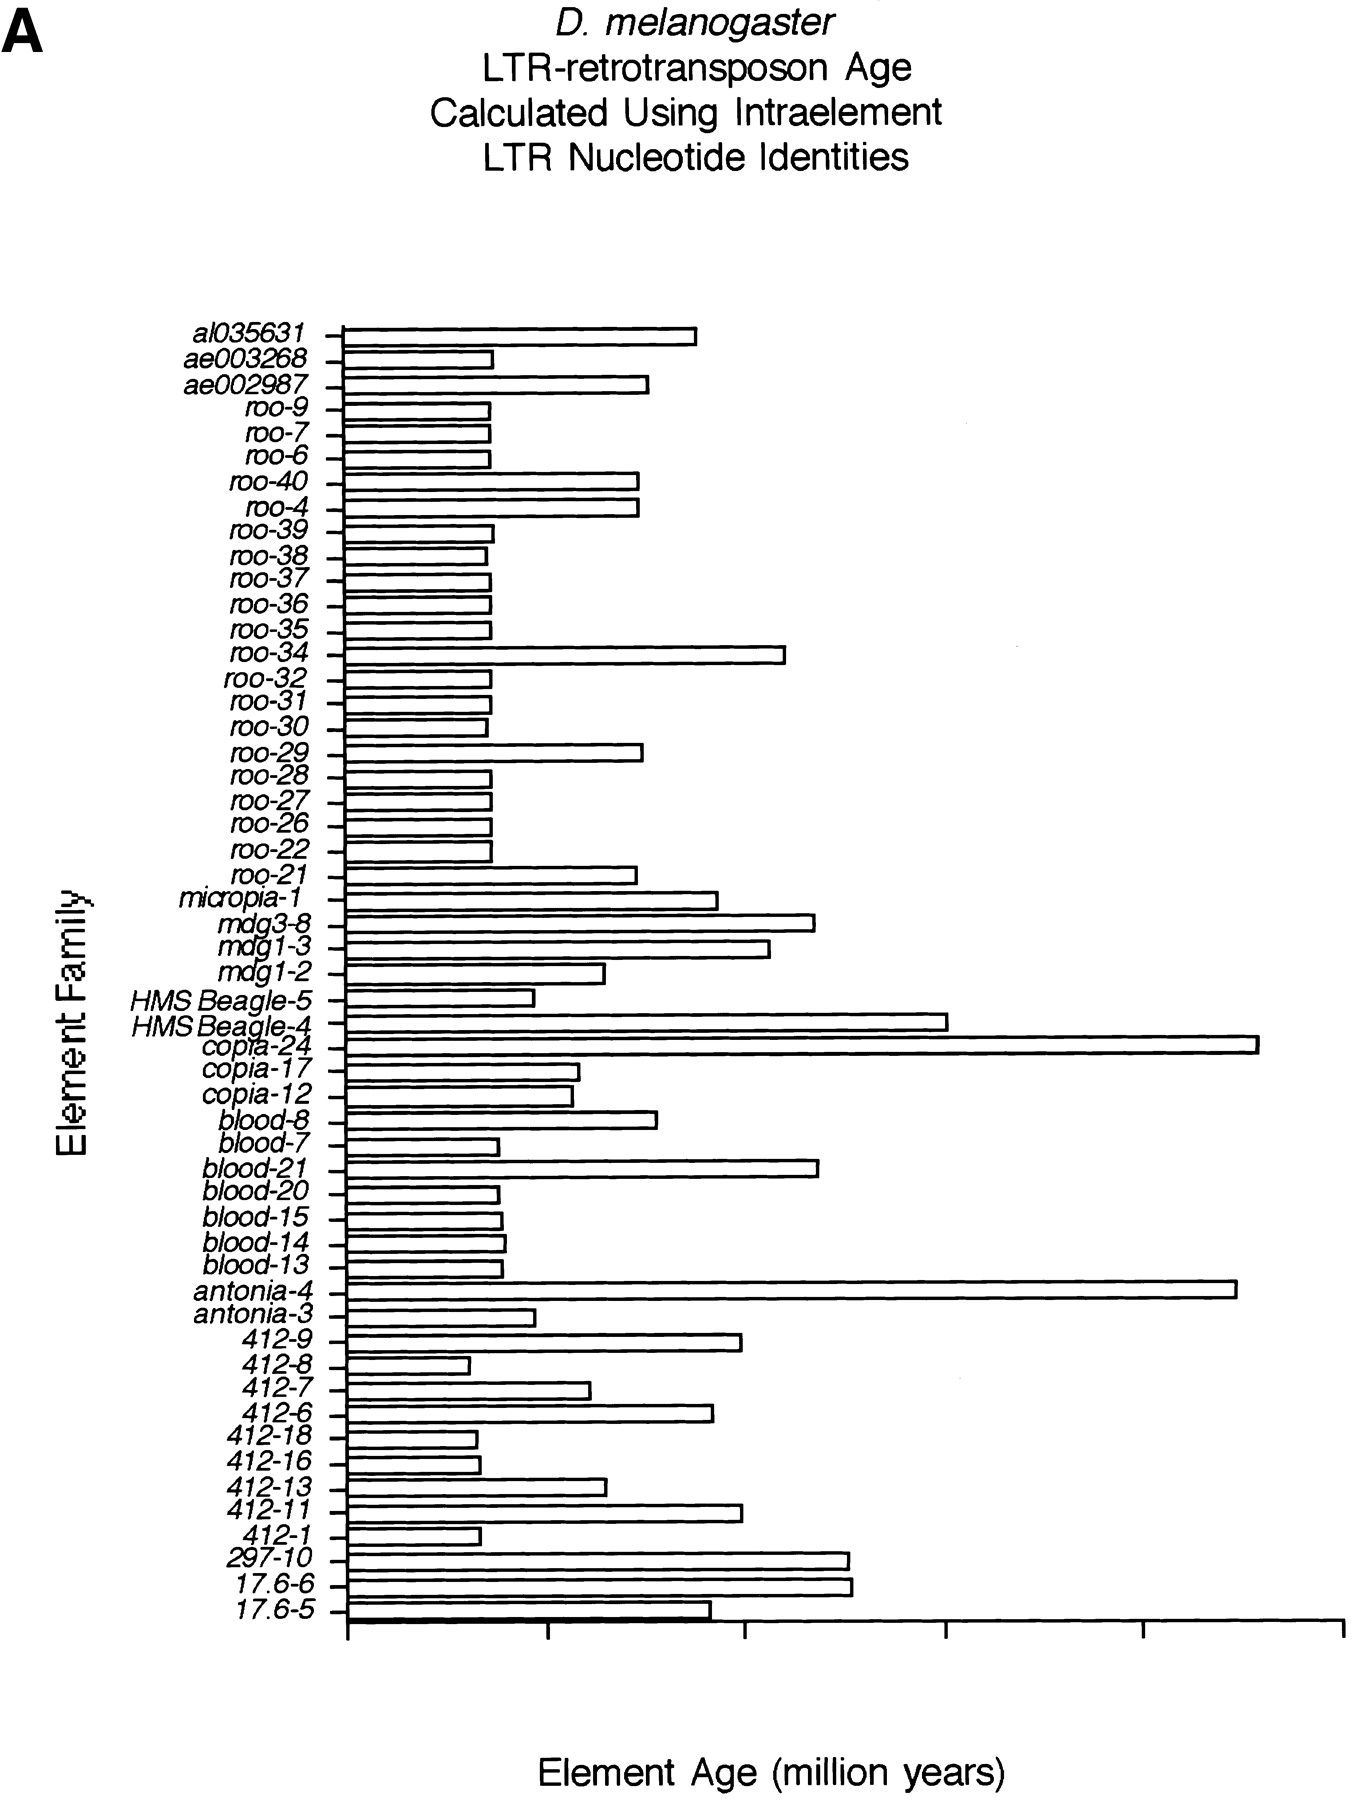
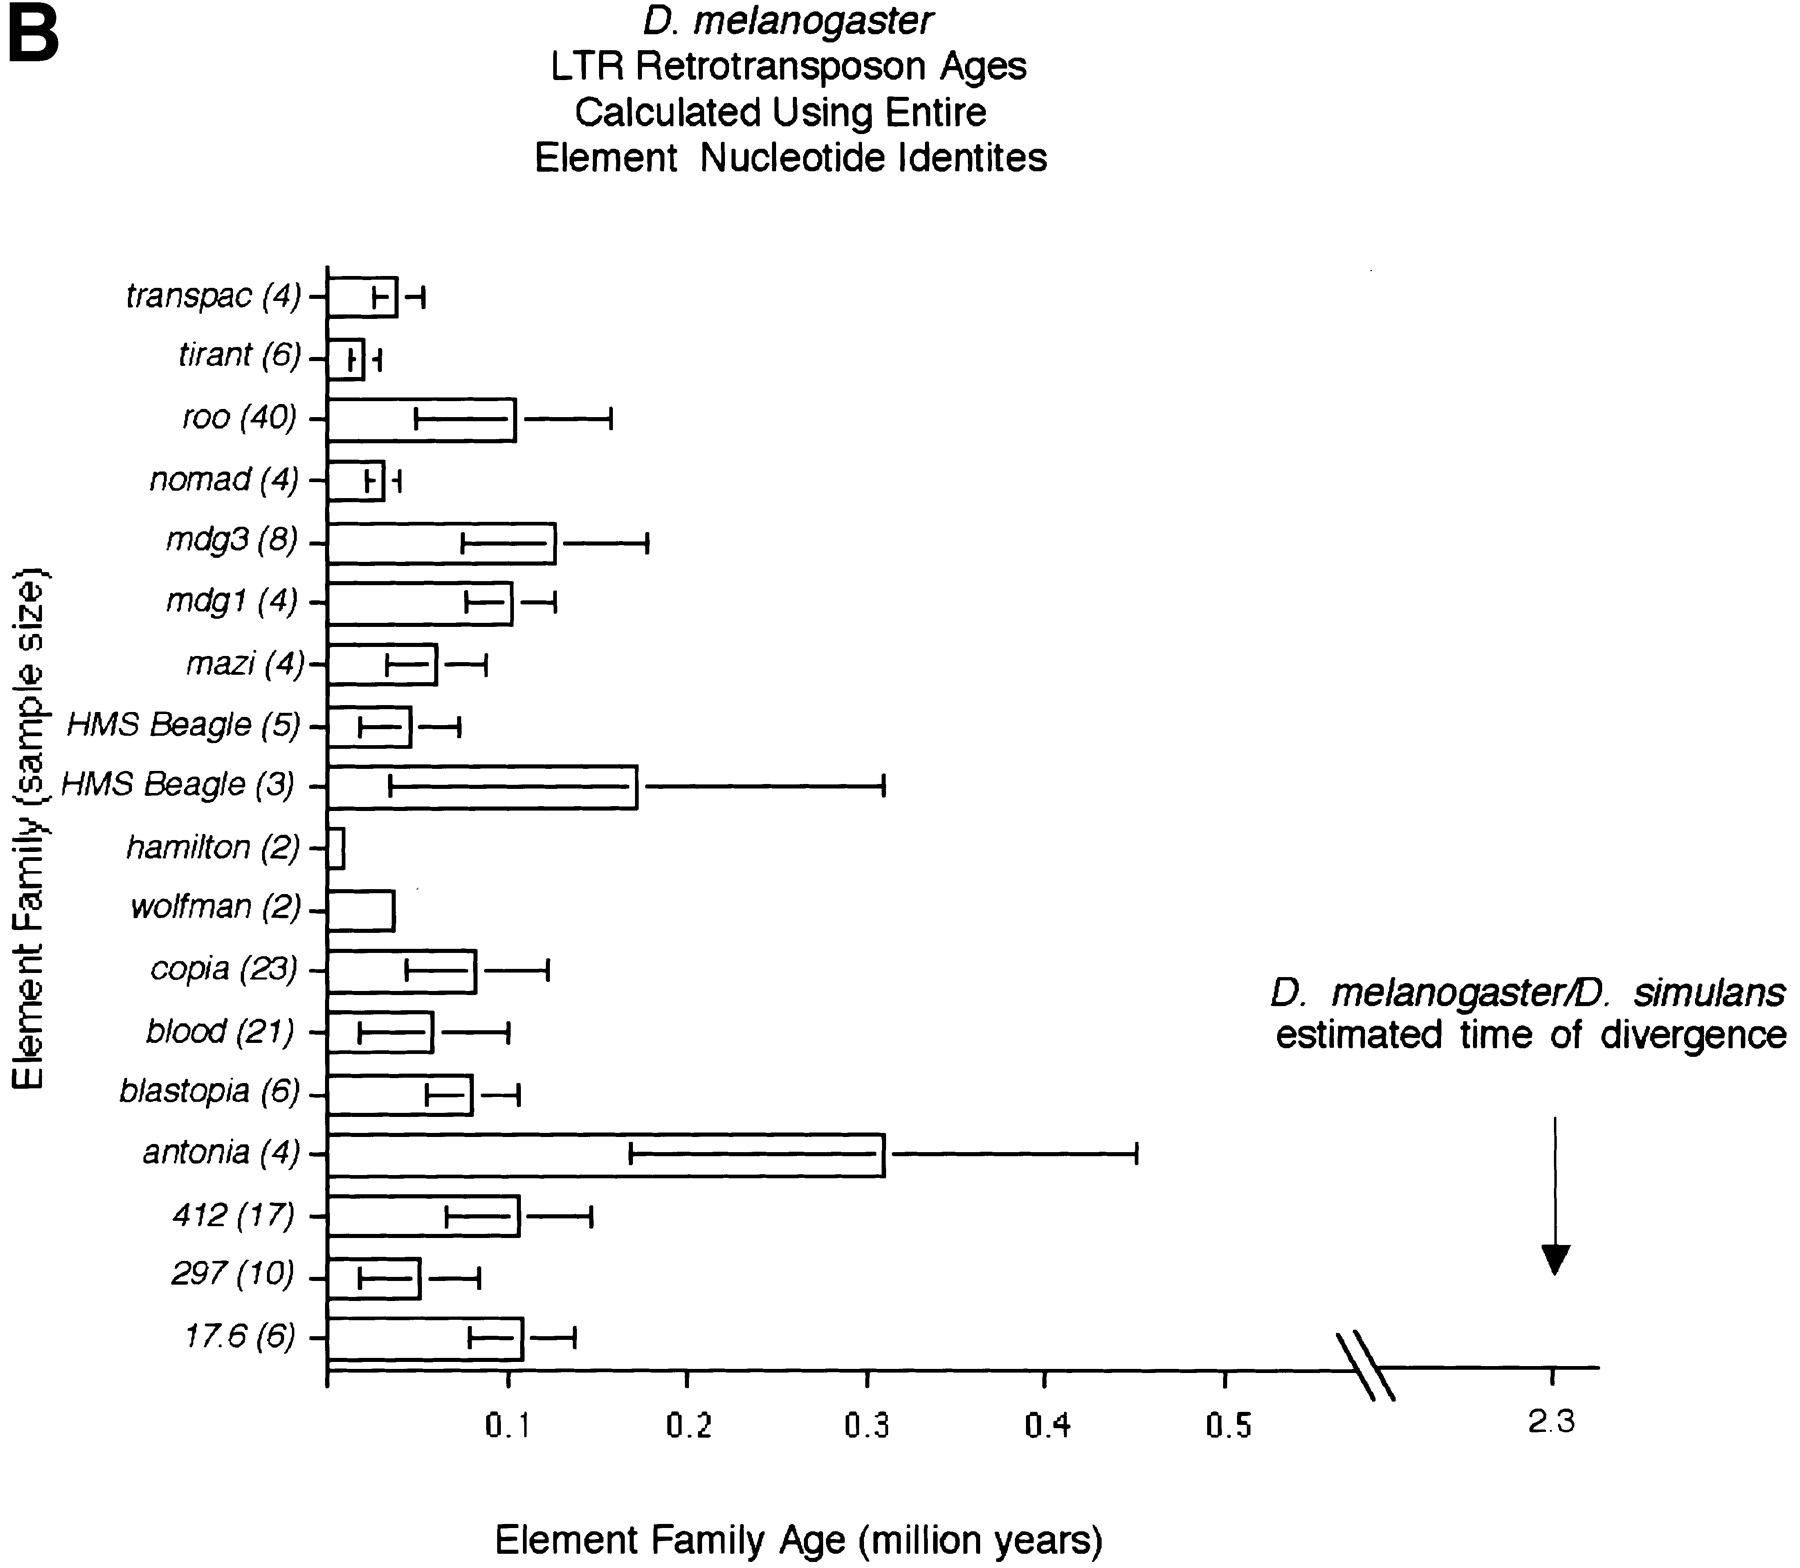
Figure 5.
(A) Graph of LTR retrotransposon element ages of those elements that contain LTR nucleotide divergence values other than zero. (B) Graph of LTR retrotransposon family ages based on average pairwise identities of elements contained within a single family. The number of elements is shown in parentheses following the family name. Error bars indicate standard deviation of ages.


