
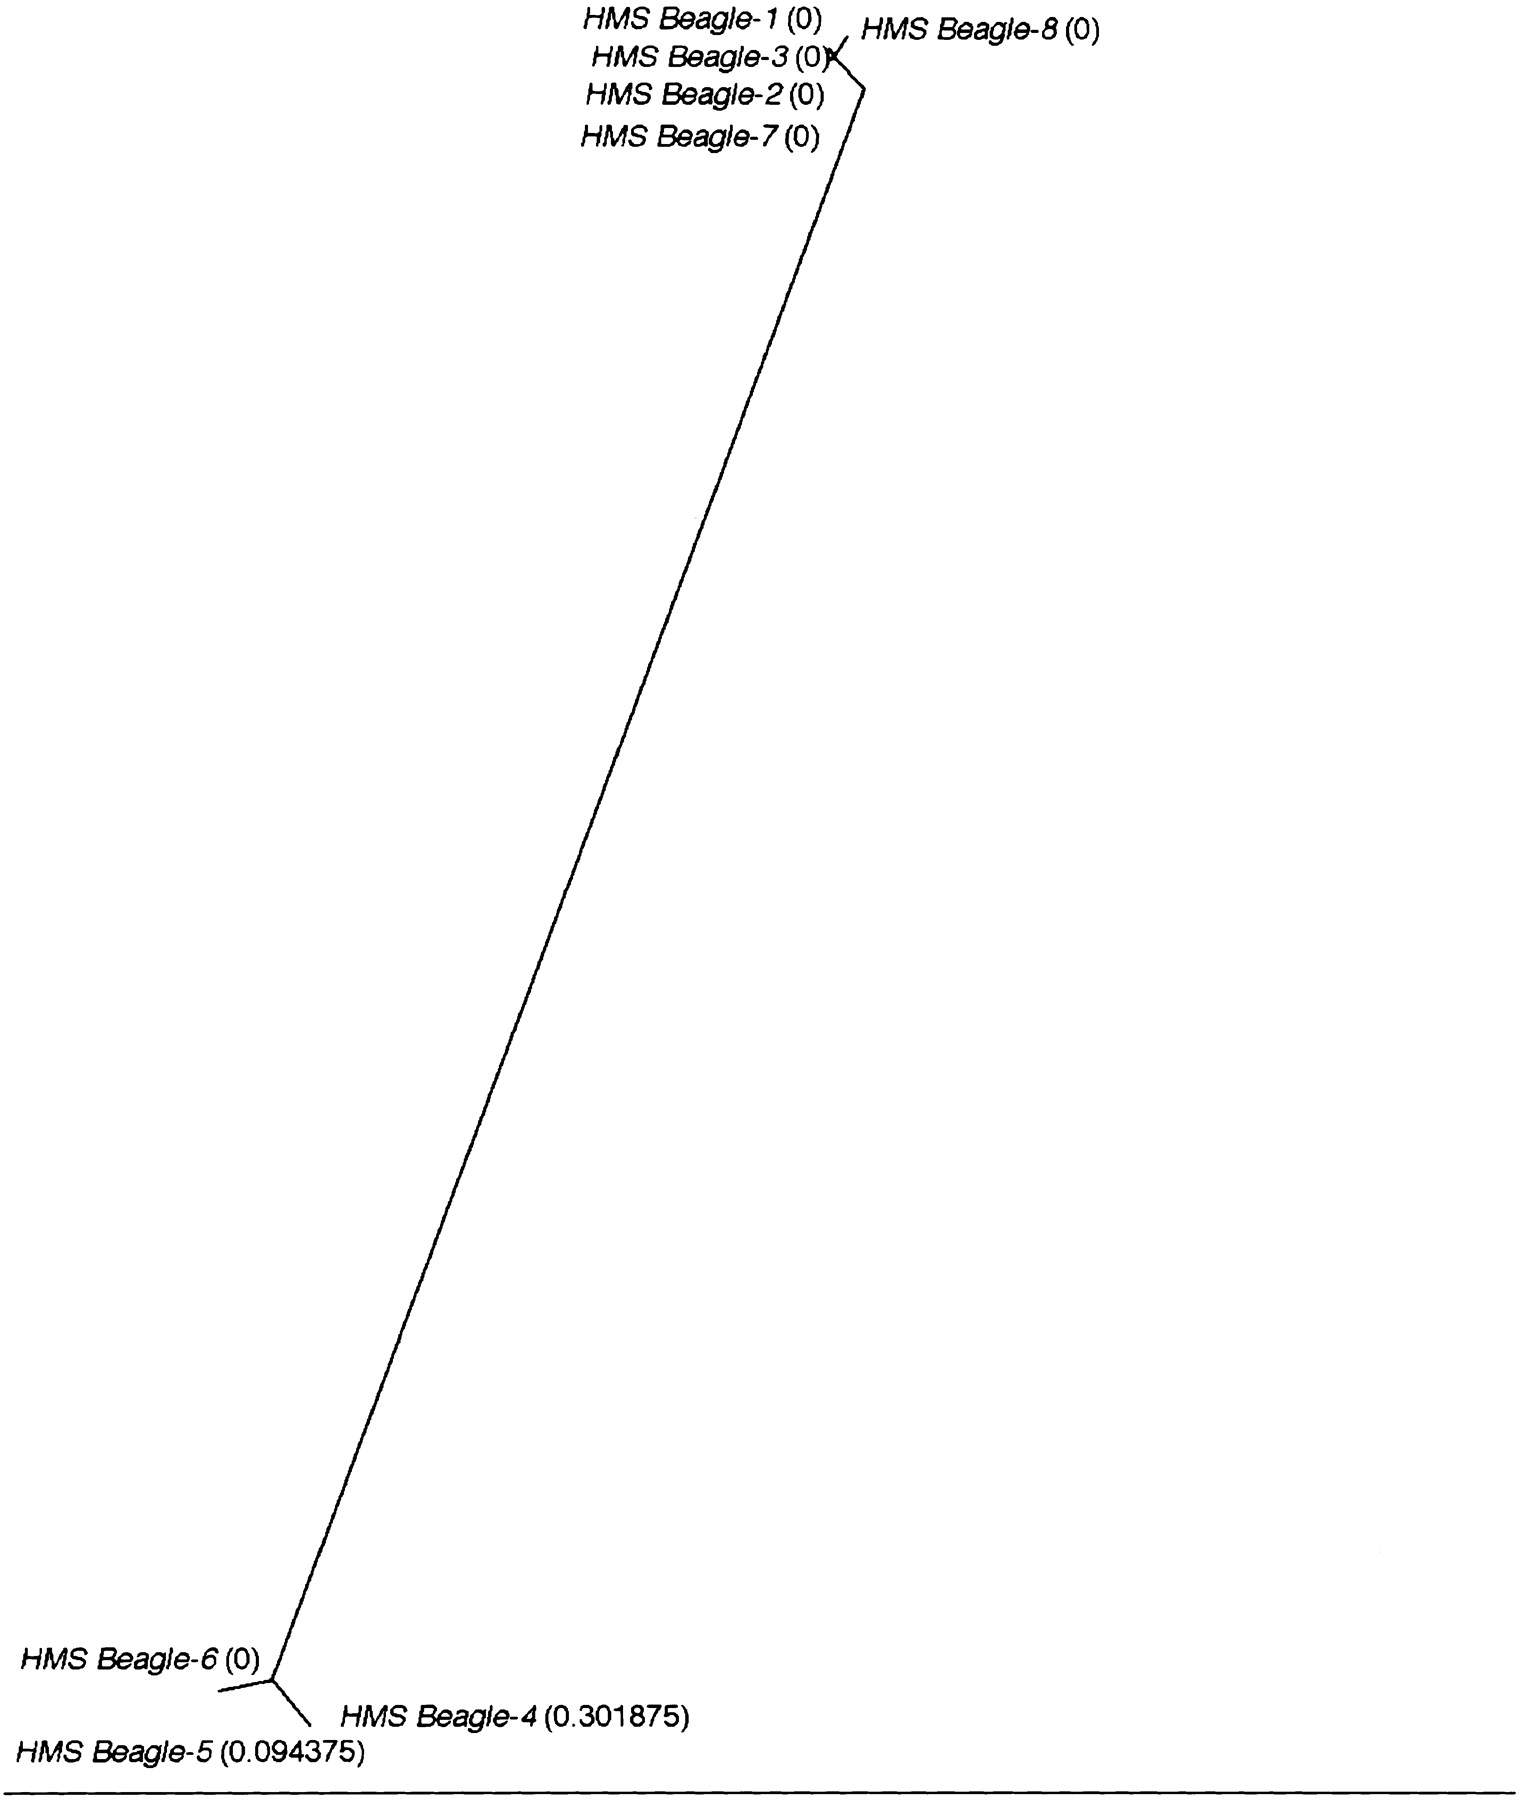
Figure 3.
Unrooted neighbor joining phylogram of the nucleotide alignments of theHMS Beagle elements. Bootstrap values are shown on branches. The age of the individual elements as calculated by LTR sequence divergence is shown in parentheses following the name of the individual elements.


