
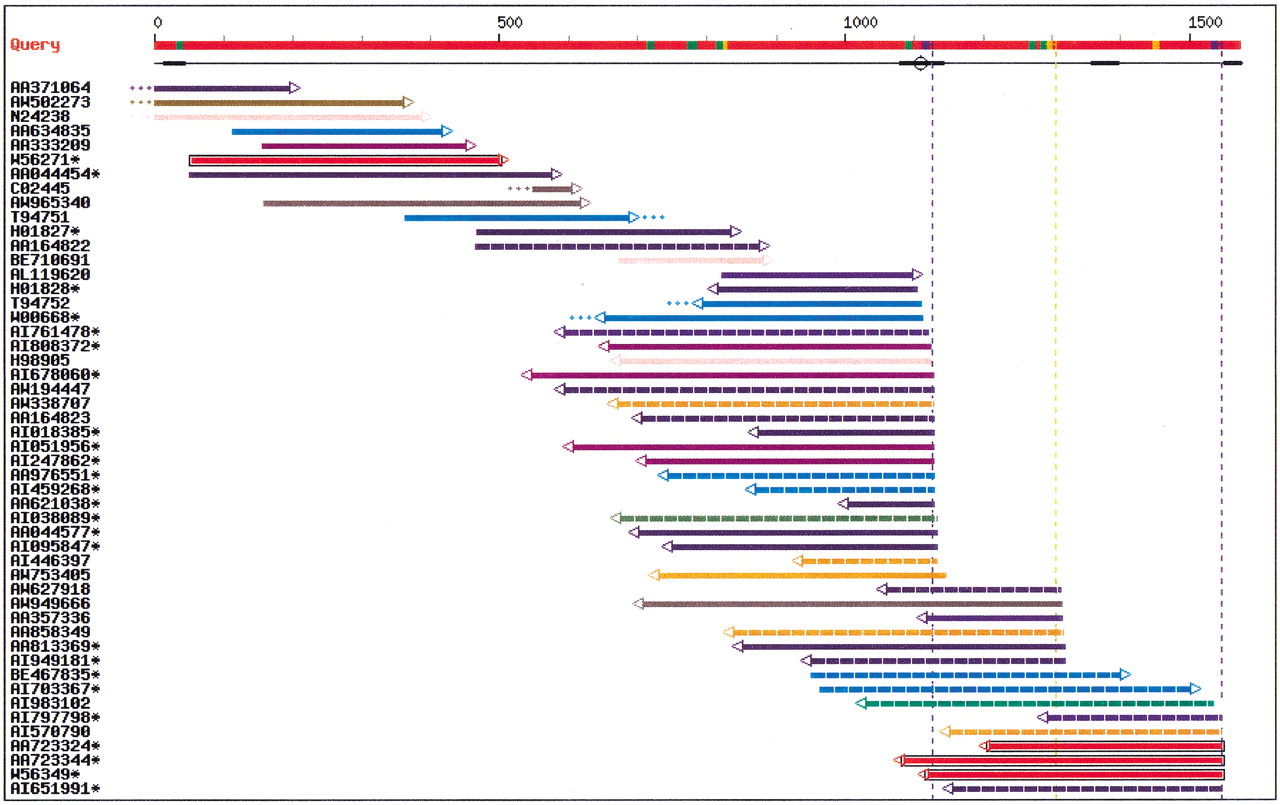
EST-parser output for the 3′ untranslated region of a zinc-finger DNA-binding protein mRNA (EMBL accession no. D45132, Muraosa et al. 1996). The red line on top represents the query sequence. Potential poly(A) signals are shown with colored boxes: blue, AAUAAA signals; orange, AUUAAA signals; green, other alternate signals. The next line indicates regions masked for their unspecific content (low complexity, vectors, mammalian repeats) using a thickened line, and potential internal priming sites (adenine stretches) are indicated by open circles. Vertical broken lines indicate putative polyA sites. When a signal is present, the vertical line has the same color as the signal box, otherwise, the line is grey. Each EST is then represented by a horizontal line incorporating information by means of a color code. EST coloring is made according to the organ system of the EST library (see Table 1). Color coding is as follows: olive, cell line; lime, central nervous system; fuschia, connective tissues; orange, digestive system; green, endocrine glands; dark slate blue, exocrine glands; blue, immune system; purple, mixed tissues; yellow, peripheral nervous system; aqua, respiratory system; maroon, squelettic; pink, skin; grey, unknown; navy, uro-genital; red, vascular system. The EST line also shows dangling ends of 20 nt or more (dots at extremities); 5′ to 3′ direction of EST sequence (arrow at extremity); and possible evidence of library-specific 3′ end (black box around EST line). Asterisks indicate ESTs from normalized or subtracted libraries. In the Web interface, additional library information is available by sliding the mouse over any EST in the chart. Organ name and Library Id. Will appear in a pop-up box (using Microsoft Internet Explorer) or at the bottom of the window (using Netscape), along with various information on the EST match, such as: Genbank ID of EST, dbEST library Id, tissue name, disease/normal state, EST length, percent identity with query sequence, coordinates for query and EST, signal type, signal position on query, and presence or absence of A/T tail on EST.


