
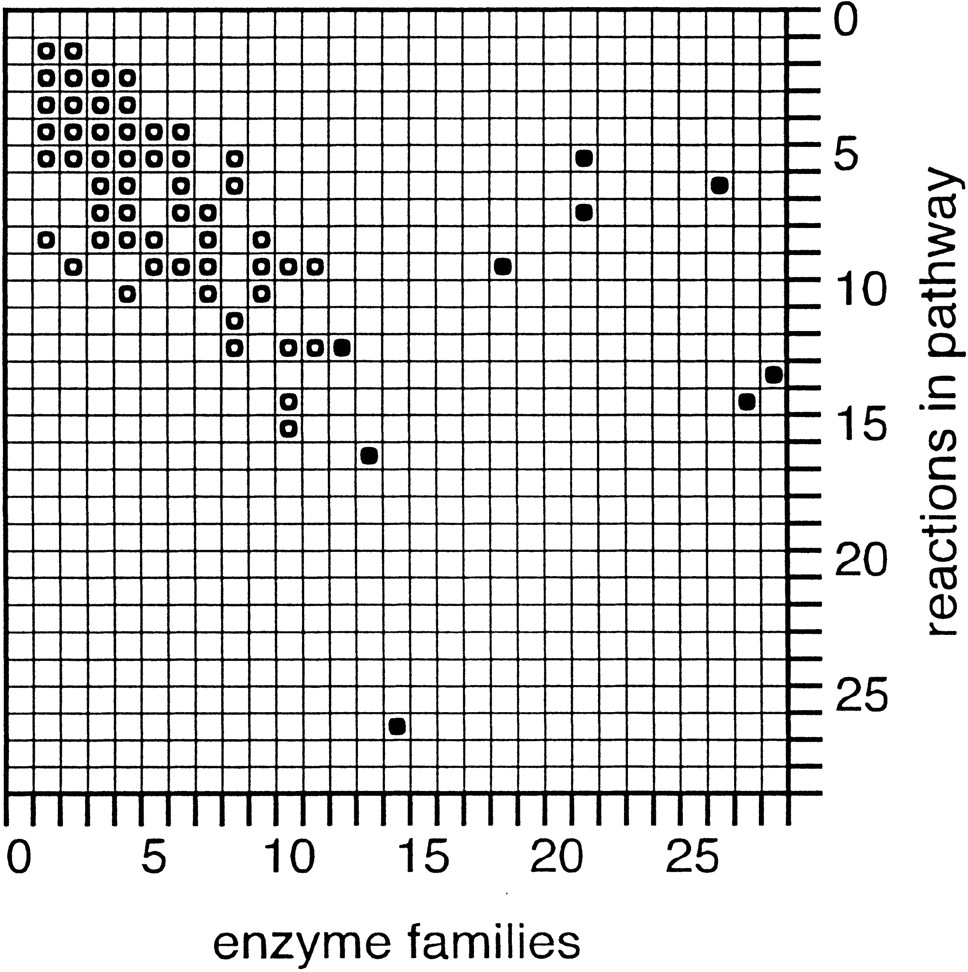
Figure 7.
The relationship of enzyme families (X-axis) to the number of individual steps per pathway (Y-axis). If there were a one-to-one correspondence of enzyme family types and biochemical reactions, the dominant pattern would be on the diagonal of this matrix. (●) The nine pathways spanning 12 or more enzyme families (mentioned in the Results section); (○) pathway counts (Z-axis, data not shown) and most contain more than one pathway count.


