
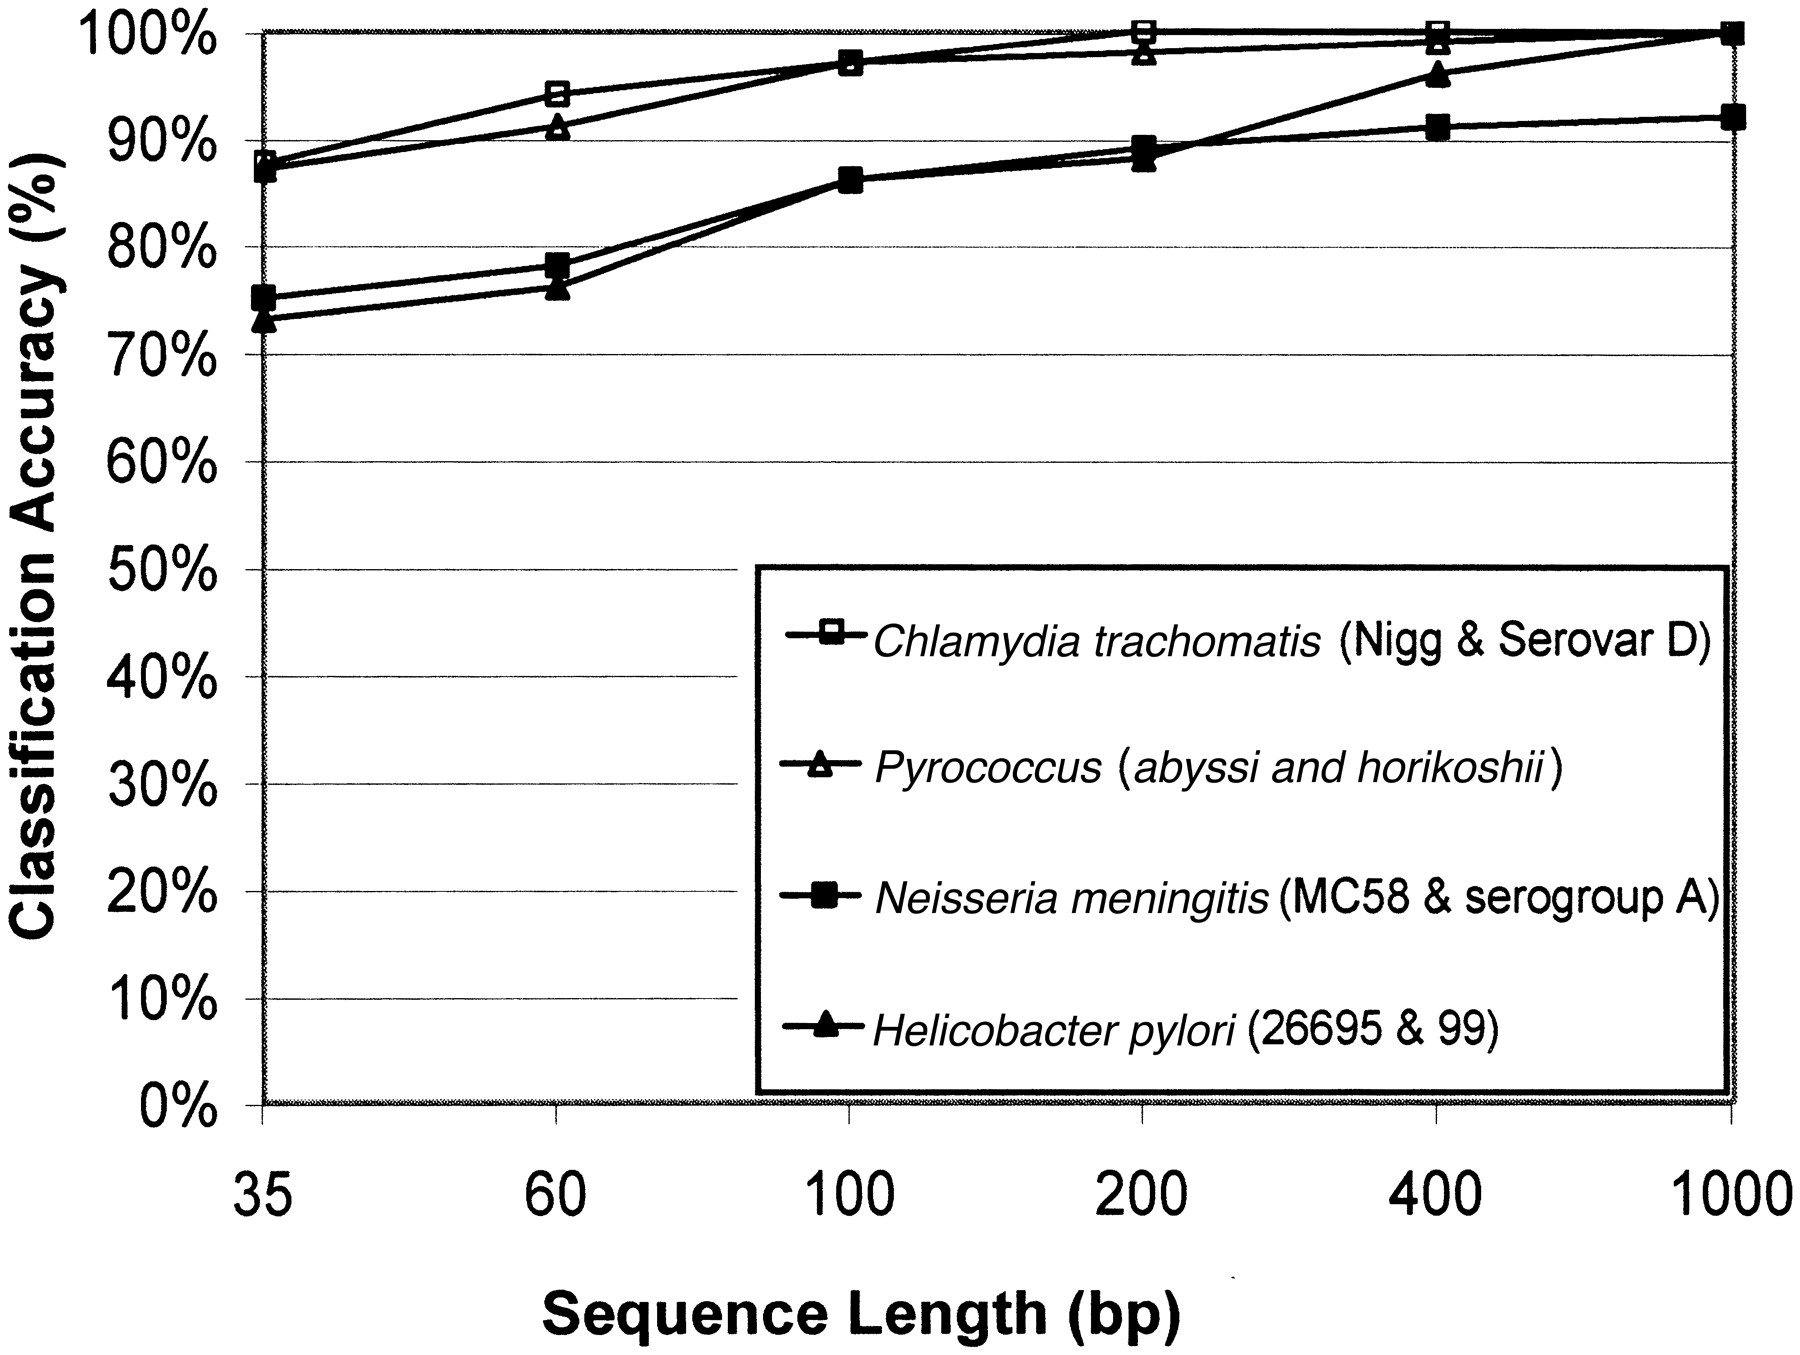
Figure 5.
Classification of closely related microorganisms. Classification accuracy between different strains of the same species. The classification accuracy in percent is represented on they-axis as the mean of the ratio of correct predictions, divided by the total number of predictions for each genome and test runs. The x-axis represents the different sequence lengths (35, 60, 100, 200, 400, and 1000) in base pairs. We sampled 100 genomic sequences for each genome and sequence length.


