
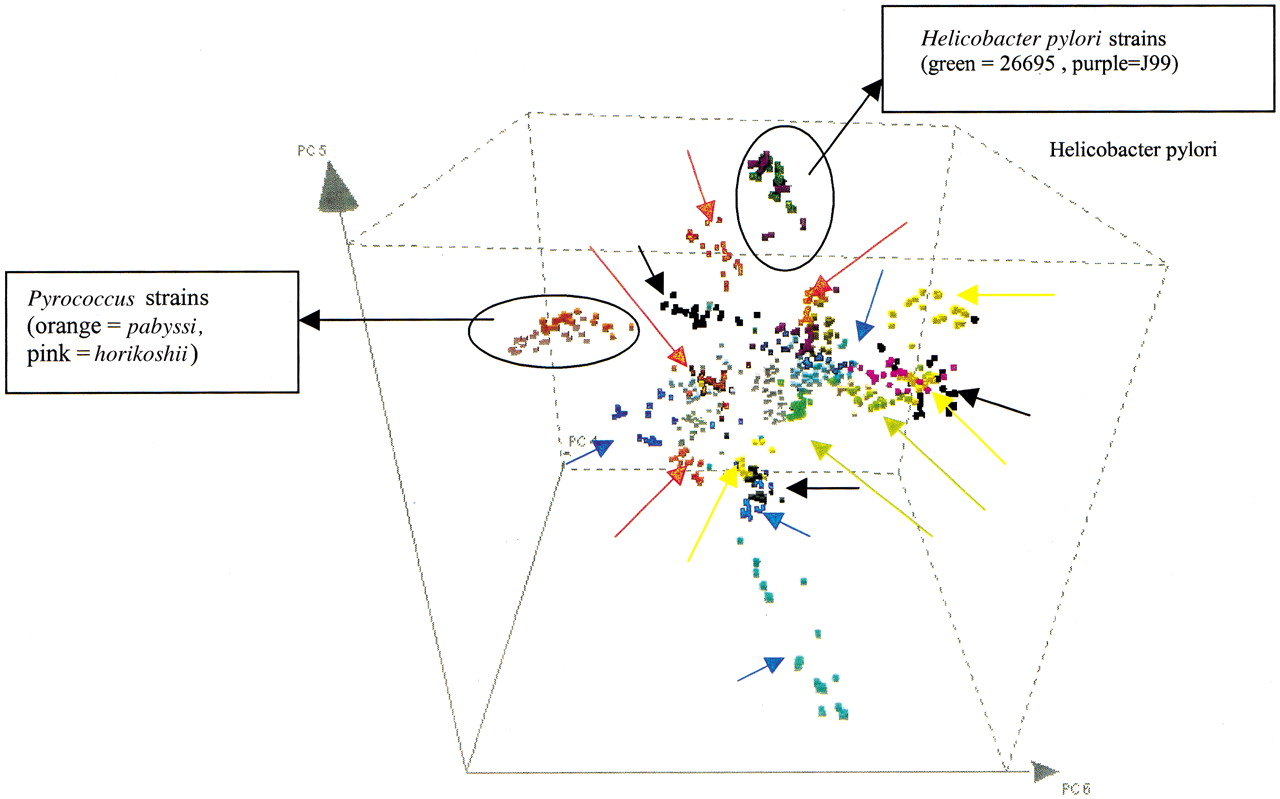
Visualizing the genomic signature concept. Principal components analysis (PCA) was performed on the motif frequencies of 25 genomic sequences from each eubacterial and archaeal genome. The sequences are mapped into a three-dimensional PCA-space, drawn by three principal components (here components 4, 5, and 6). Each sequence was randomly chosen and had a length of 1000 bp. Closely related microorganisms cluster together in PCA-space here shown for Pyrococcusstrains pabyssi and horikoshii and forHelicobacter pylori strains 26695 and J99. For clarity, arrows indicate each distinct genome cluster when similar colors were used to plot the sequences from different eubacterial and archaeal genomes. The figure was plotted using Spotfire (Spotfire Inc.).


