
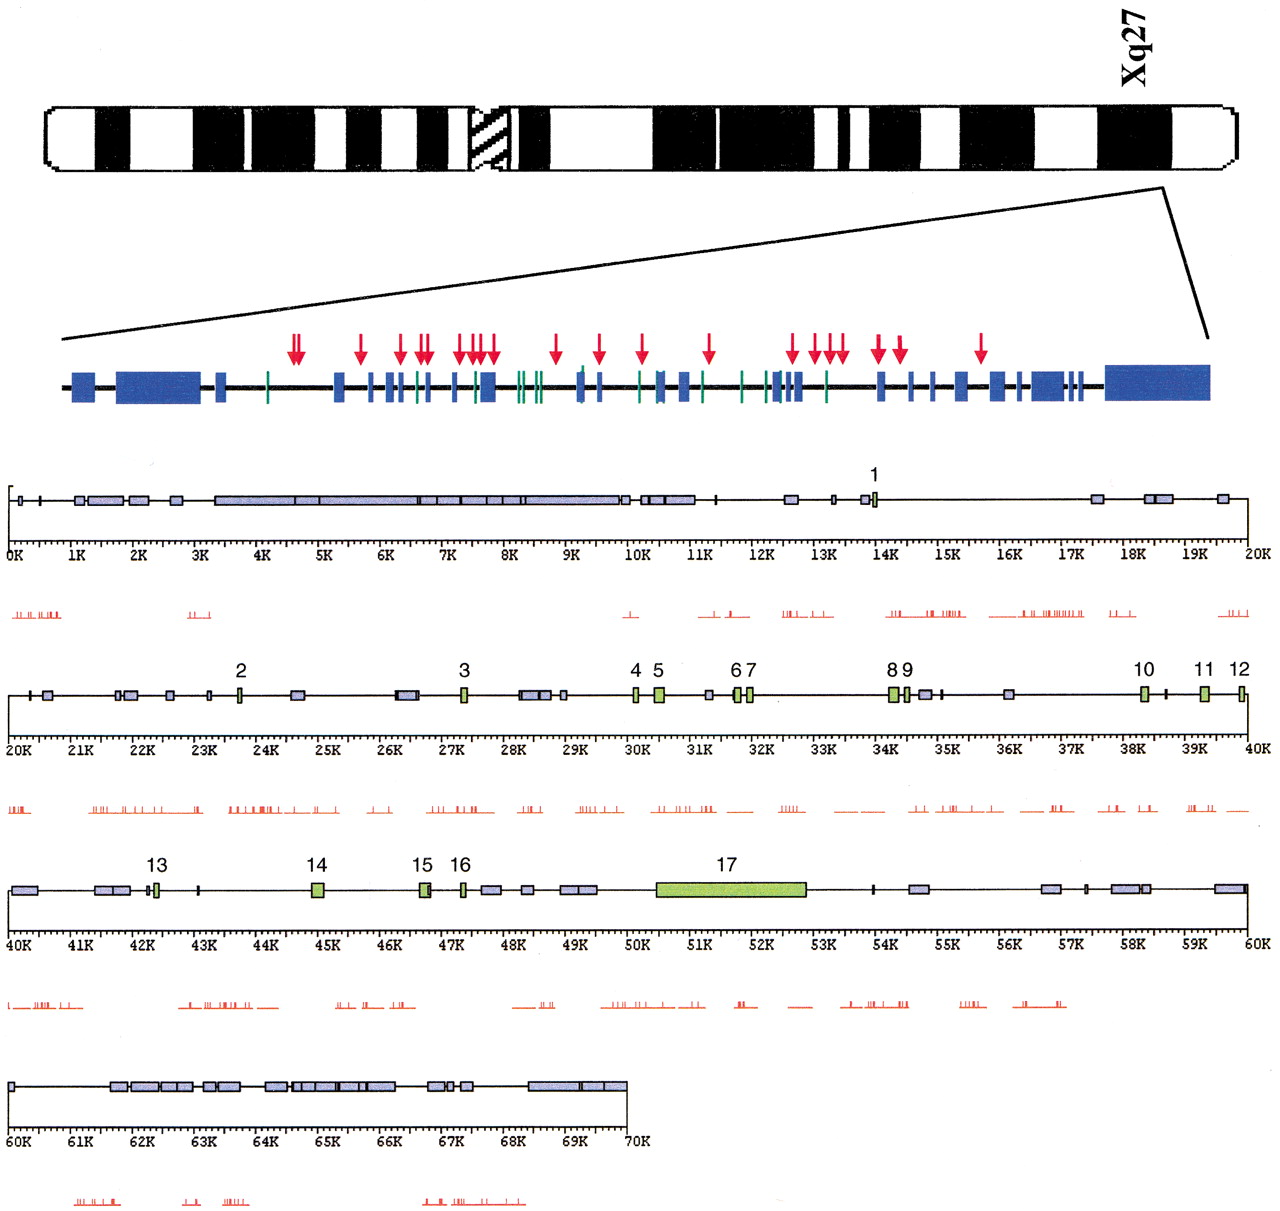
Figure 1.
The genomic structure of the FMR1 region. The ideogram of the X chromosome shows the location of the FMR1 region, subsequently magnified to show the region we studied. The green bars identify FMR1 exons, numbered accordingly. The blue bars represent regions masked byRepeatMasker. The red arrows locate the SNPs found among the 20 humans sampled. This region is further magnified below, with the modification that the red bars are the segments screened for variation and the thin red hash marks identify all differences from the reference sequence.


