
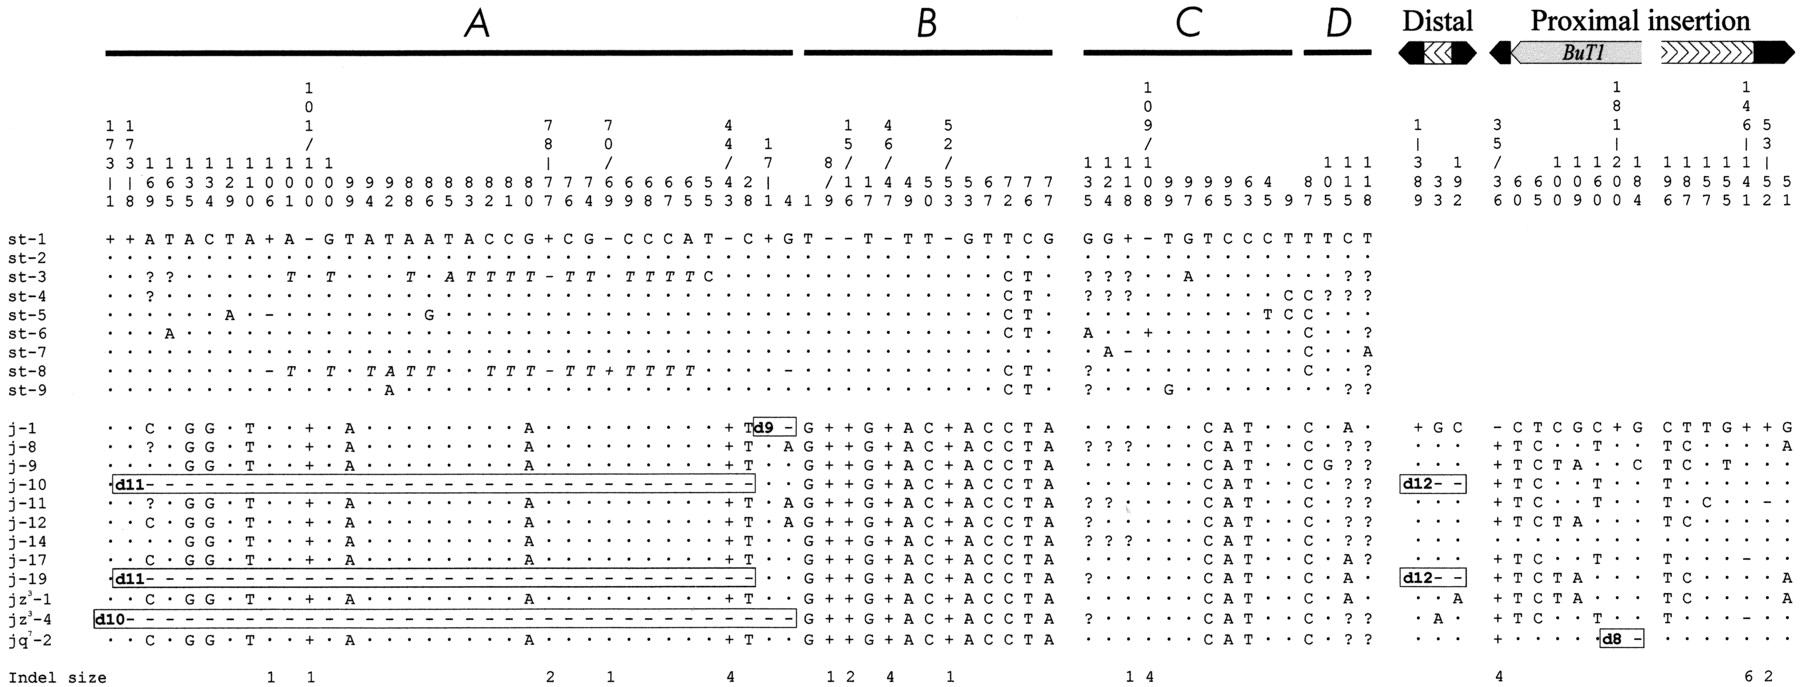
Nucleotide polymorphism at the breakpoint regions of inversion2j. Nucleotide position is represented above the sequences. The breakpoints are taken as start point of A, B, C, D, distal breakpoint insertion, and proximal breakpoint insertion sequences. Nucleotides identical to the first sequence are indicated by a dot and missing data by a question mark. Deletions and insertions are indicated by minus and plus signs, respectively, and their size in base pairs is shown below. Gross deletions affecting the sequenced regions are named as in Fig. 2and are included in rectangles. TE insertions and target site duplications are not shown. In 2st lines there is a 18-bp stretch between A and B sequences resemblingGalileo footprints (Cáceres et al. 1999) that is not represented here either. Positions A65 to A101 in st-3 and st-8 accumulate multiple nucleotide changes with regard to the other lines and are shown in italics.


