
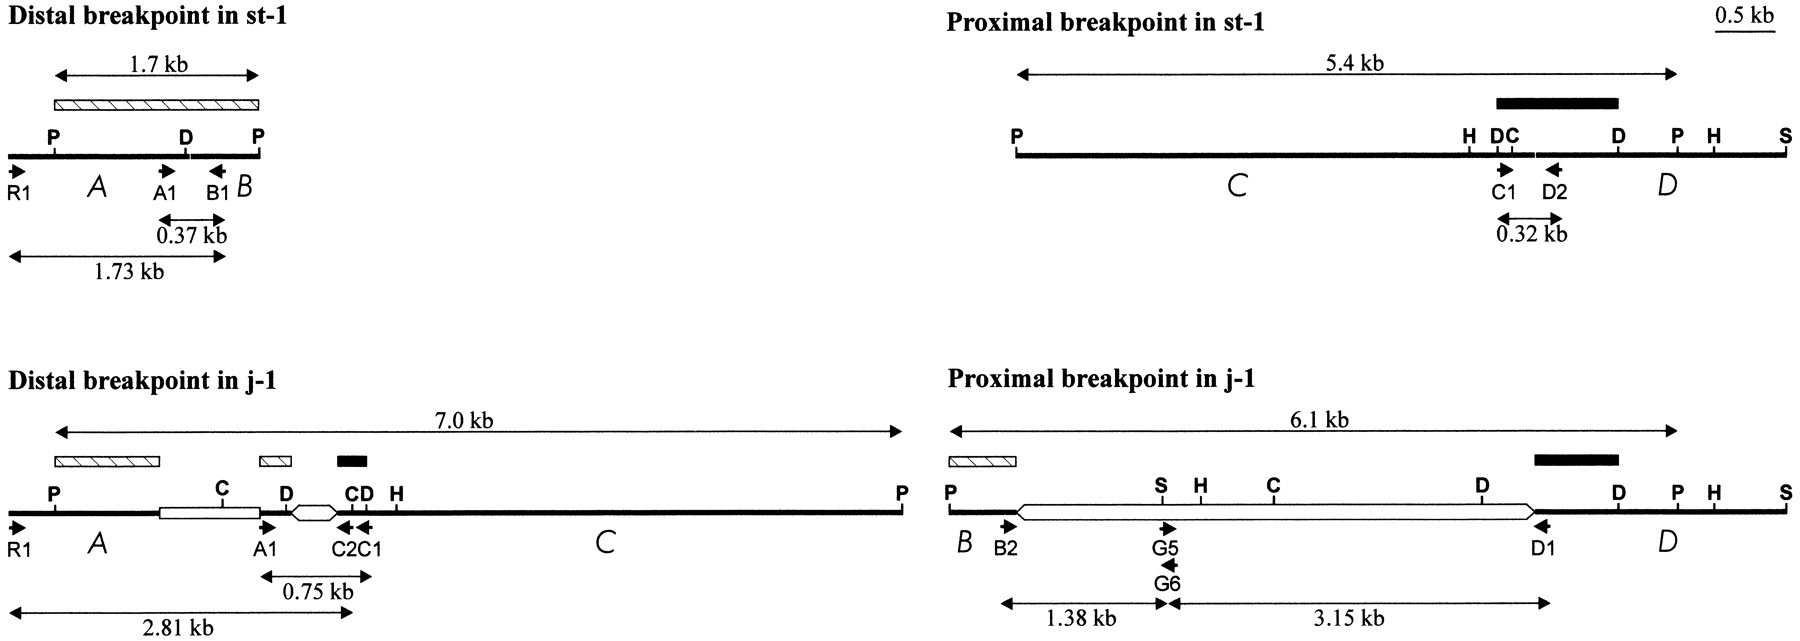
Figure 1.
Physical map of the distal and proximal 2j breakpoint regions in the st-1 and j-1 lines. Thick lines represent the single-copyA, B, C, and D sequences. TE insertions are represented as empty boxes. Hatched and black rectangles correspond, respectively, to the AB and CD probes used for the Southern hybridization analysis. Small arrows represent primers used in the PCR amplification. Some of the restriction sites found in this region are shown: C, ClaI; D, DraI; H,HindIII; P, PstI; S, SalI.


