
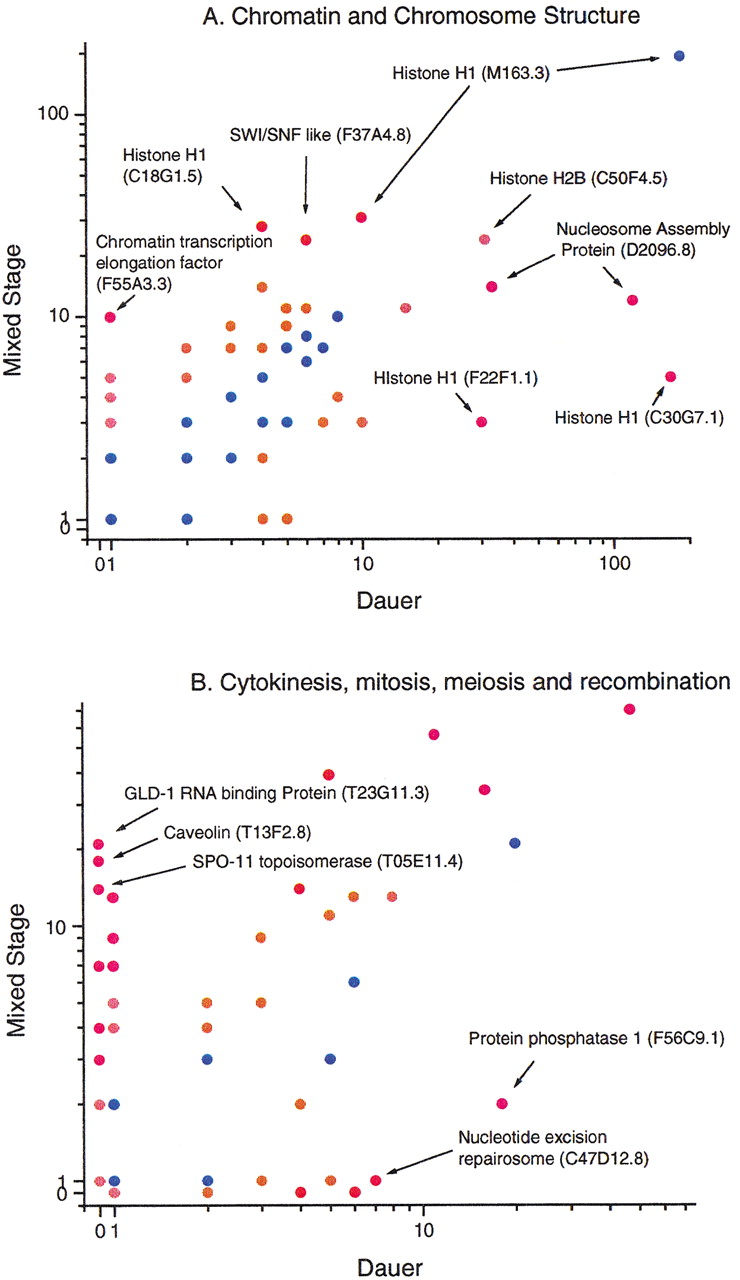
Figure 3.
Relative abundance of dauer and mixed-stage tags for genes from specific cellular processes (Costanzo et al. 2000). (blue) No significant expression difference between the two sets. (orange) Significance of P ≤ 0.05; (red) significance of P ≤ 0.01, as determined by the G test (Sokal and Rohlf 1995).


