
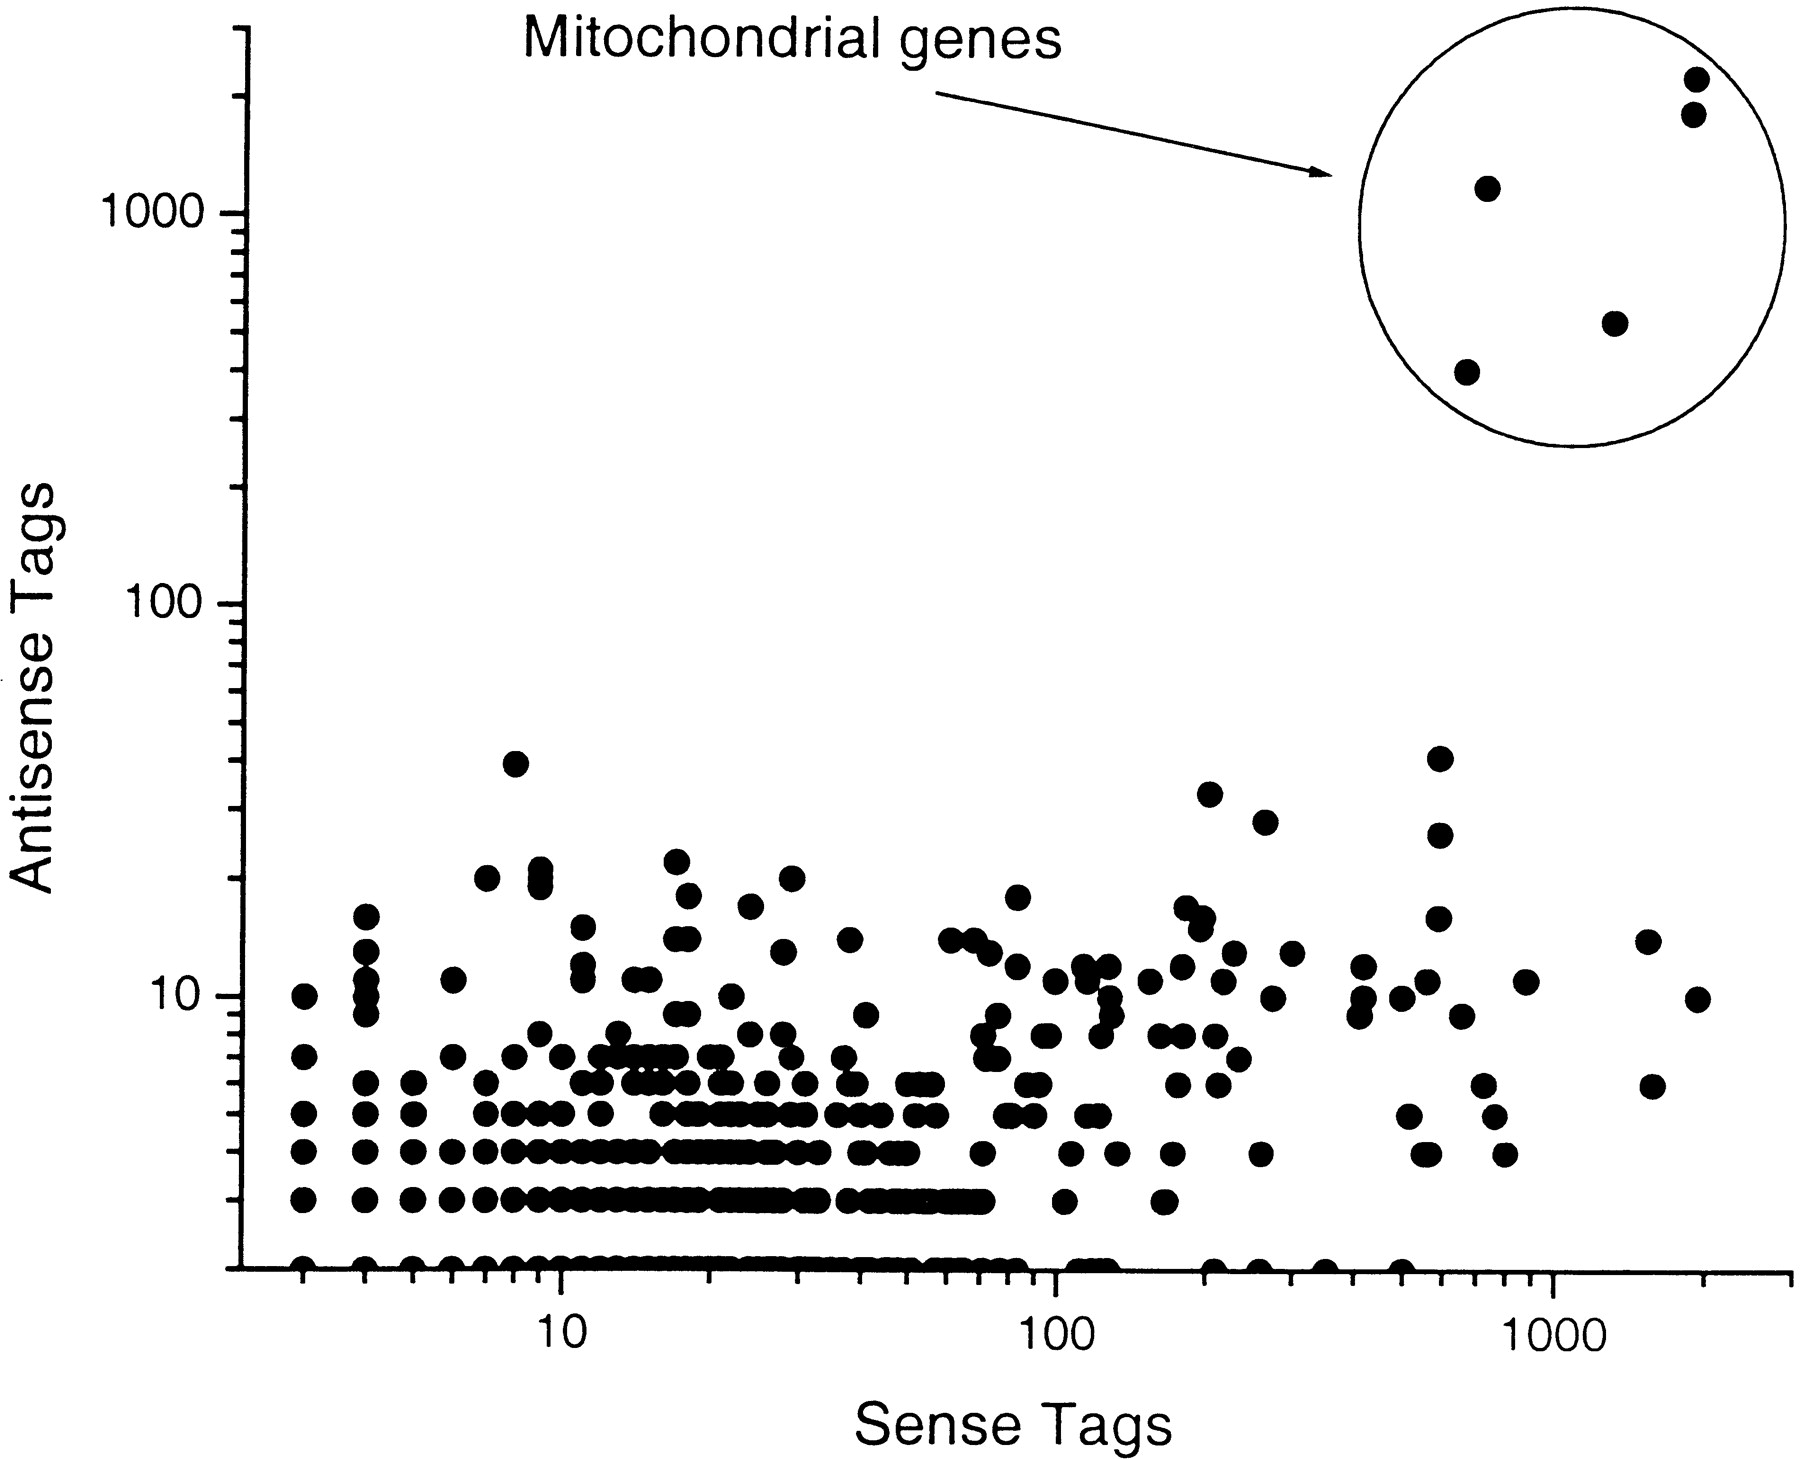
Figure 2.
Comparison of sense and antisense tag frequencies. From 6489 tag sequences matching only an antisense transcript, 549 transcripts were studied in which both the antisense and sense SAGE tags could be unambiguously correlated. Only in 56 transcripts are the antisense transcripts in a higher abundance than the sense tags.


