
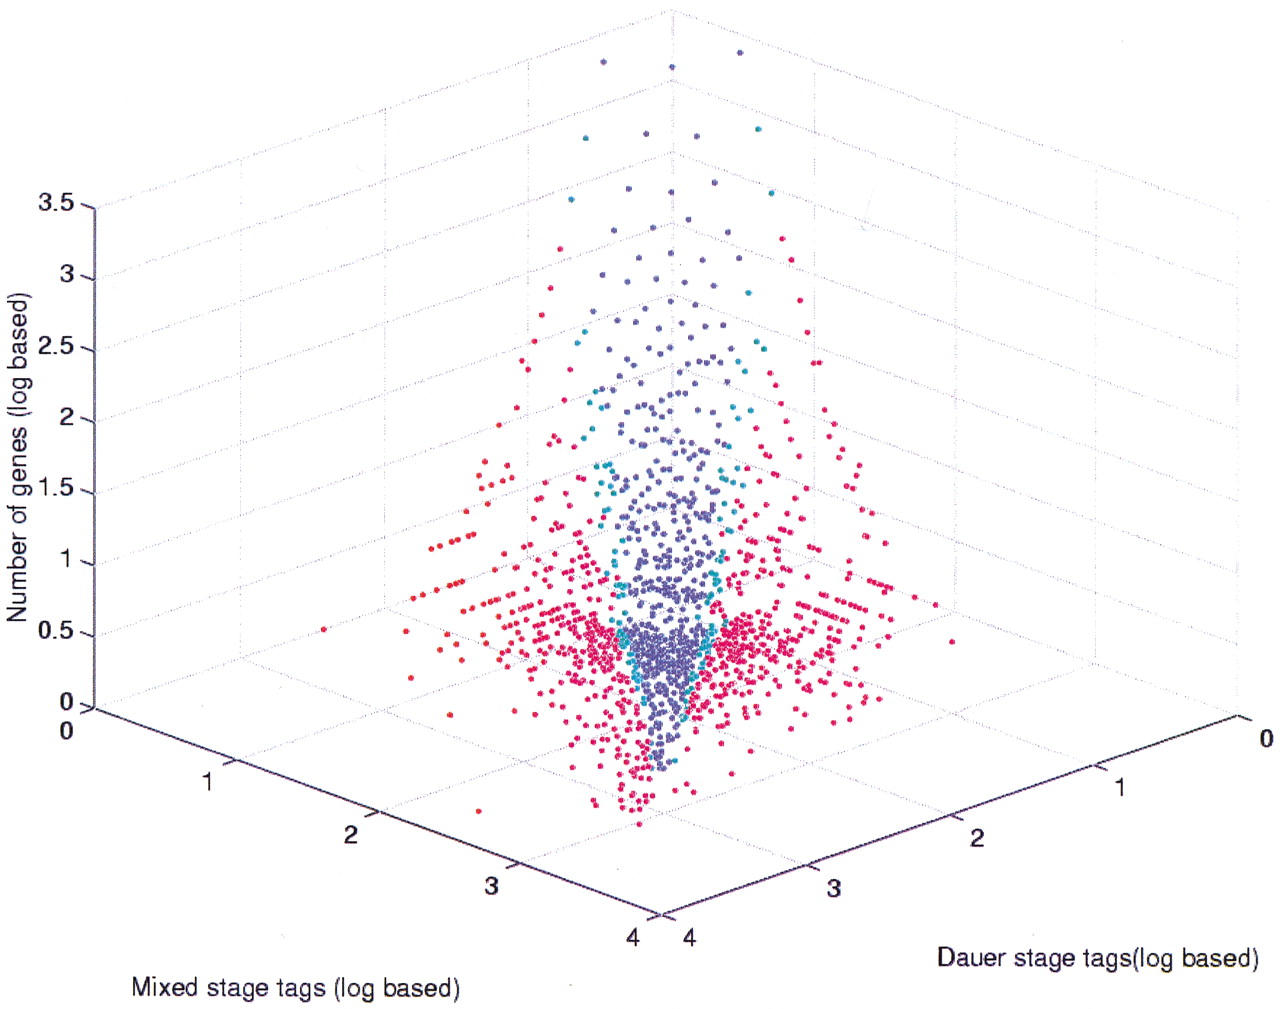
Figure 1.
Expression profile comparing relative expression in dauer and mixed stages. Singleton tags were excluded. (blue) Tags for which no significant expression difference is observed; (green) significance is 95%–99%; (red) significance >99% confidence, as determined by the G test (Sokal and Rohlf 1995). The z-axis represents the number of transcripts with a specific mixed/dauer tag ratio.


