
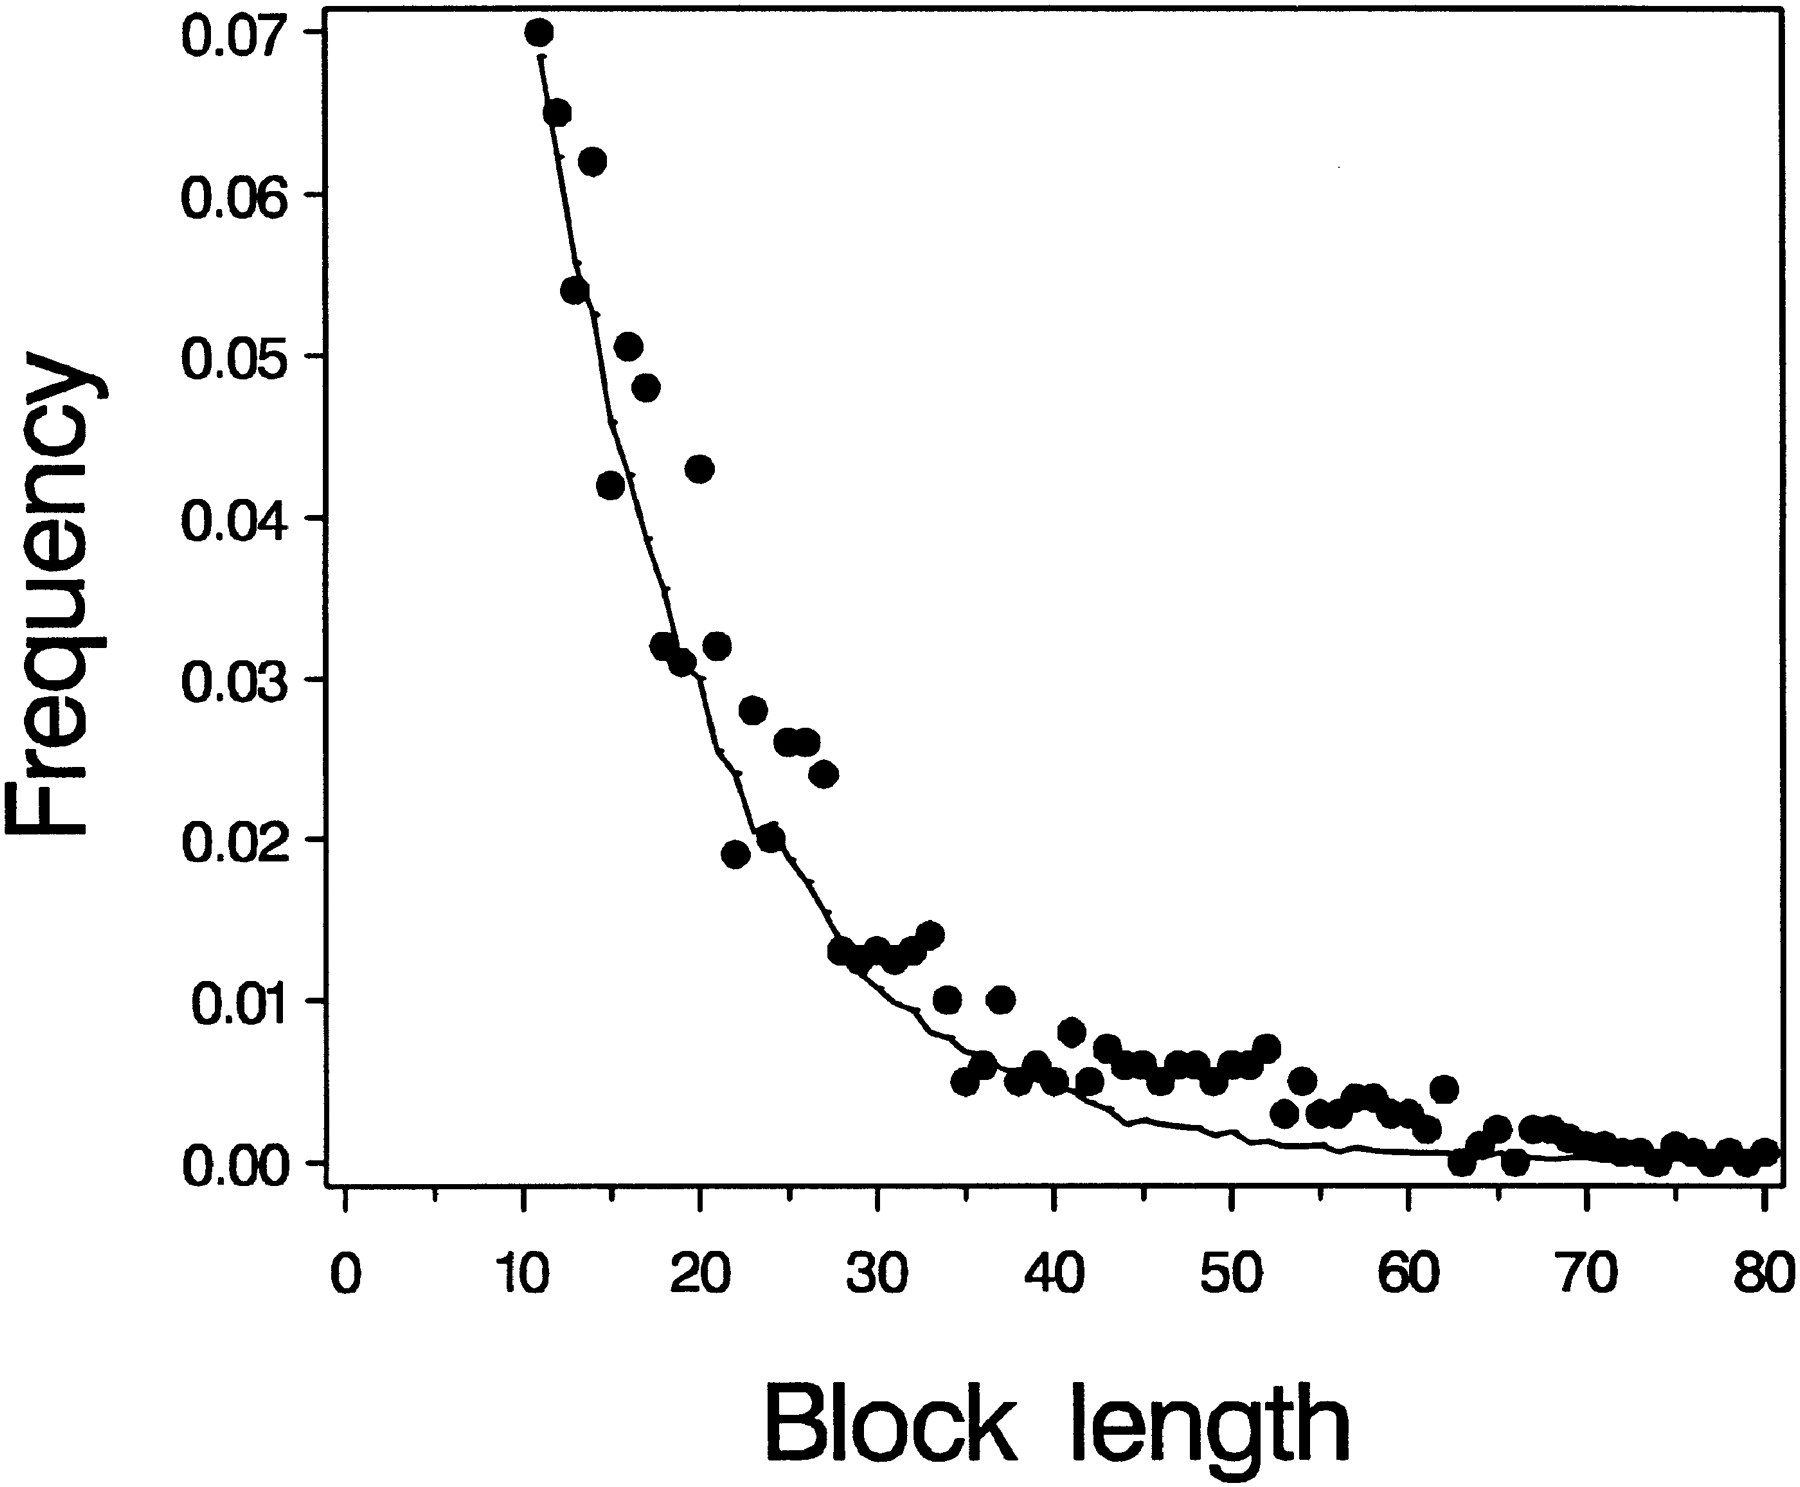
Figure 1.
Observed and simulated distribution of lengths of conserved blocks in noncoding DNA. The dots are the data taken from Bergman and Kreitman (2001) and reflect the distribution of conserved block lengths (∼70% identity and length >10 nucleotides) found between Drosophila melanogaster and Drosophila virilis in intergenic and intronic sequences. The curve was obtained by introducing 95 random substitutions per kilobase, and scoring run lengths of blocks of absolute identity from these simulated data. The plot shows only blocks of 11 bp or longer because of the potential bias against identifying shorter blocks in the observed data.


