
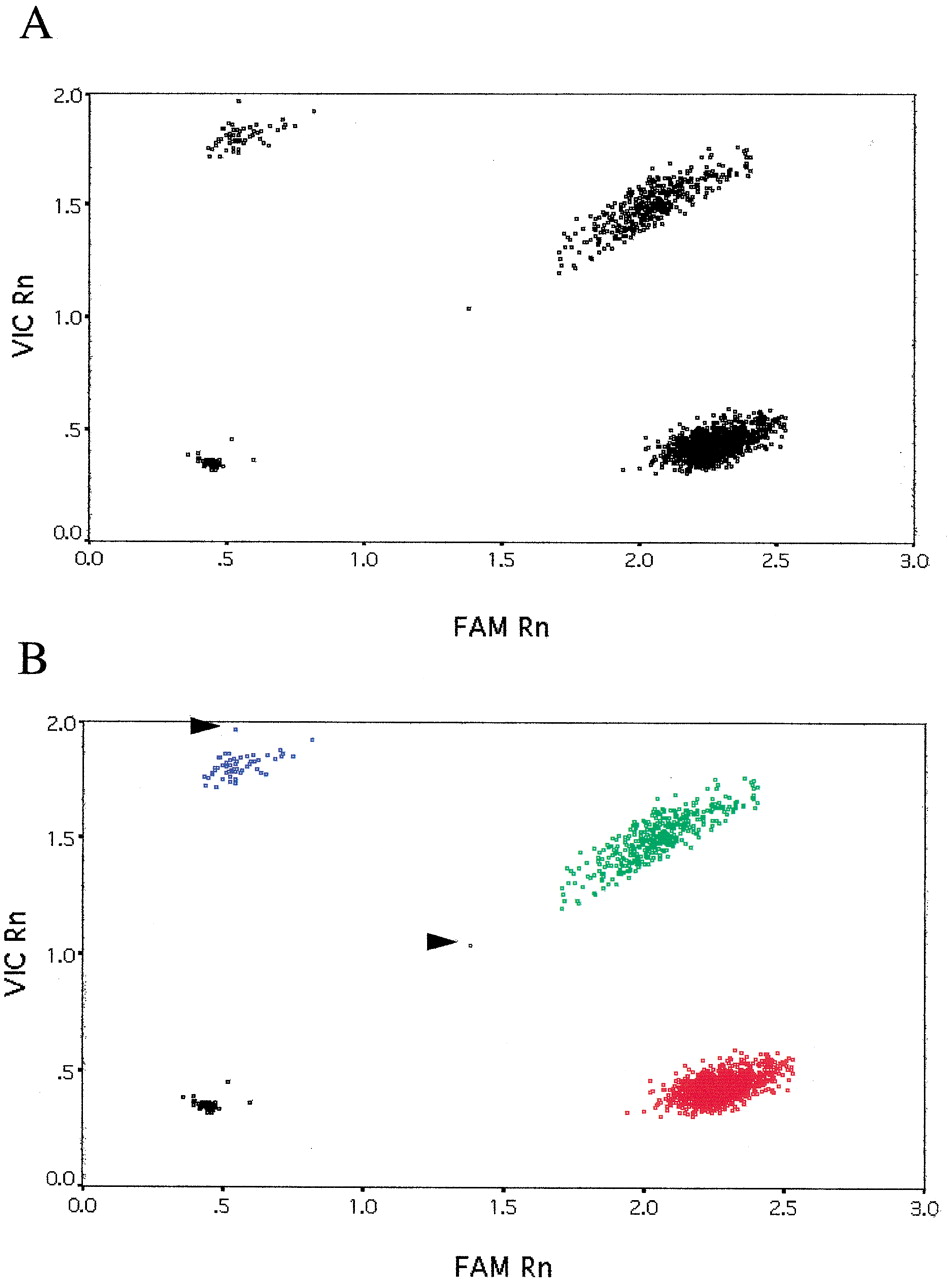
Figure 2.
Genotyping results for the CYP11B15 SNP. Data for 1699 genotypes are shown. (A) Raw data from the TaqMan PCR. (B) Output of the k-means clustering. Fluorescence values for the C and G alleles are plotted along the X andY axes, respectively. (Red squares) C/C homozygotes; (green squares) G/C heterozygotes; (blue squares) G/G homozygotes; (black squares) “no DNA” controls or failed PCRs. Arrows indicate samples with a very low conditional probability of belonging to that particular cluster.


