
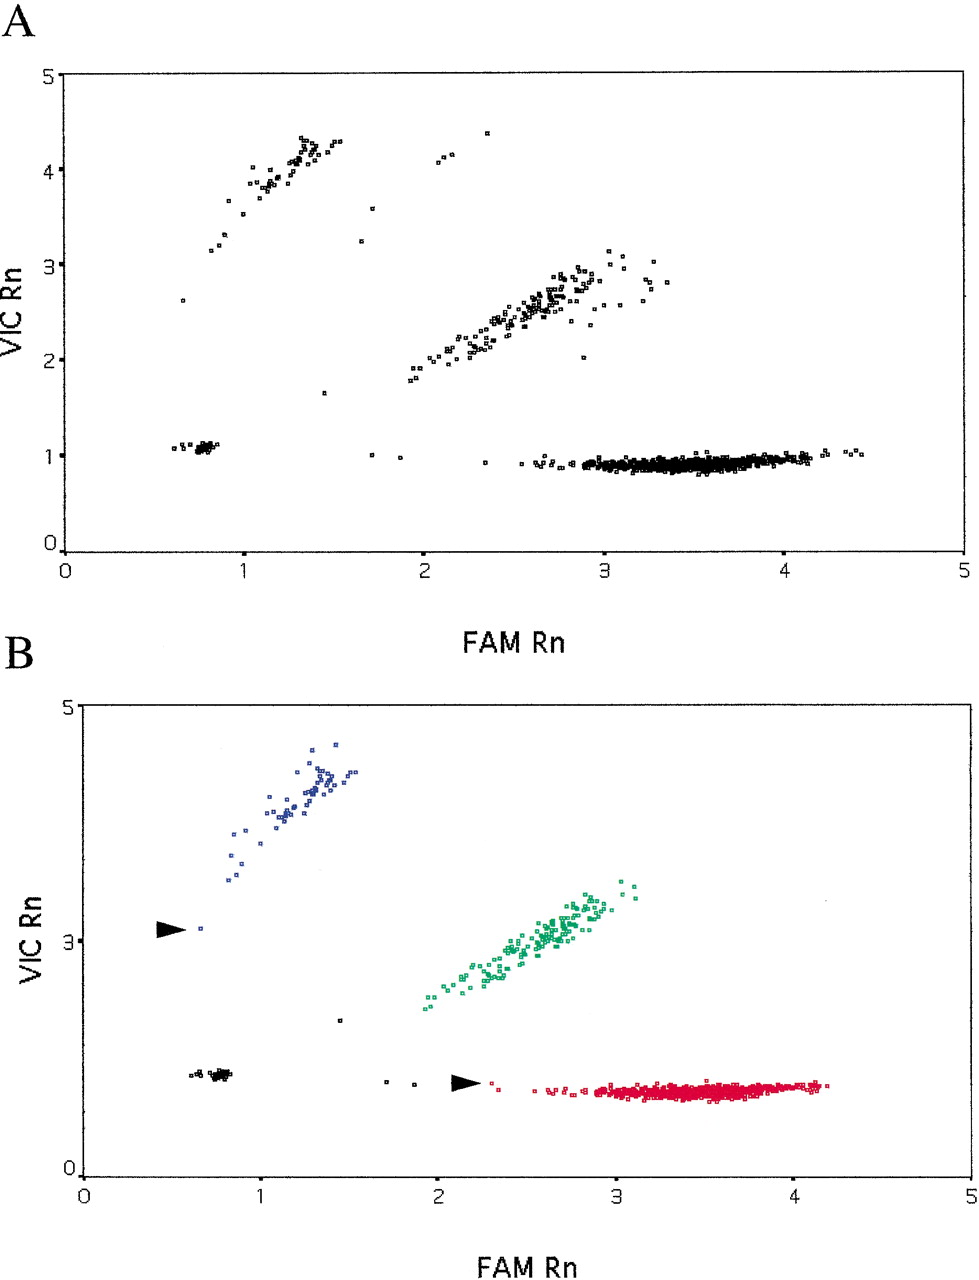
Genotyping results for the E298D SNP in the endothelial nitric oxide synthase gene. Data for 1699 genotypes are shown. (A) Raw data from the TaqMan PCR. (B) Data corrected for variation in pre-PCR fluorescence and k-means clustering. Fluorescence for the E allele is plotted along the X-axis (the dye is “FAM”) and for the D allele, labeled with the fluor “VIC”, along the Y-axis. “Rn” is fluorescence from the reporter dye divided by that from the passive reference dye. (Red squares) Samples homozygous for the E allele; (blue squares) samples homozygous for the D allele; (green squares) E/D heterozygotes; (black squares) “no DNA” controls or samples that failed to amplify. Arrows indicate samples with a very low conditional probability of belonging to that particular cluster.


