
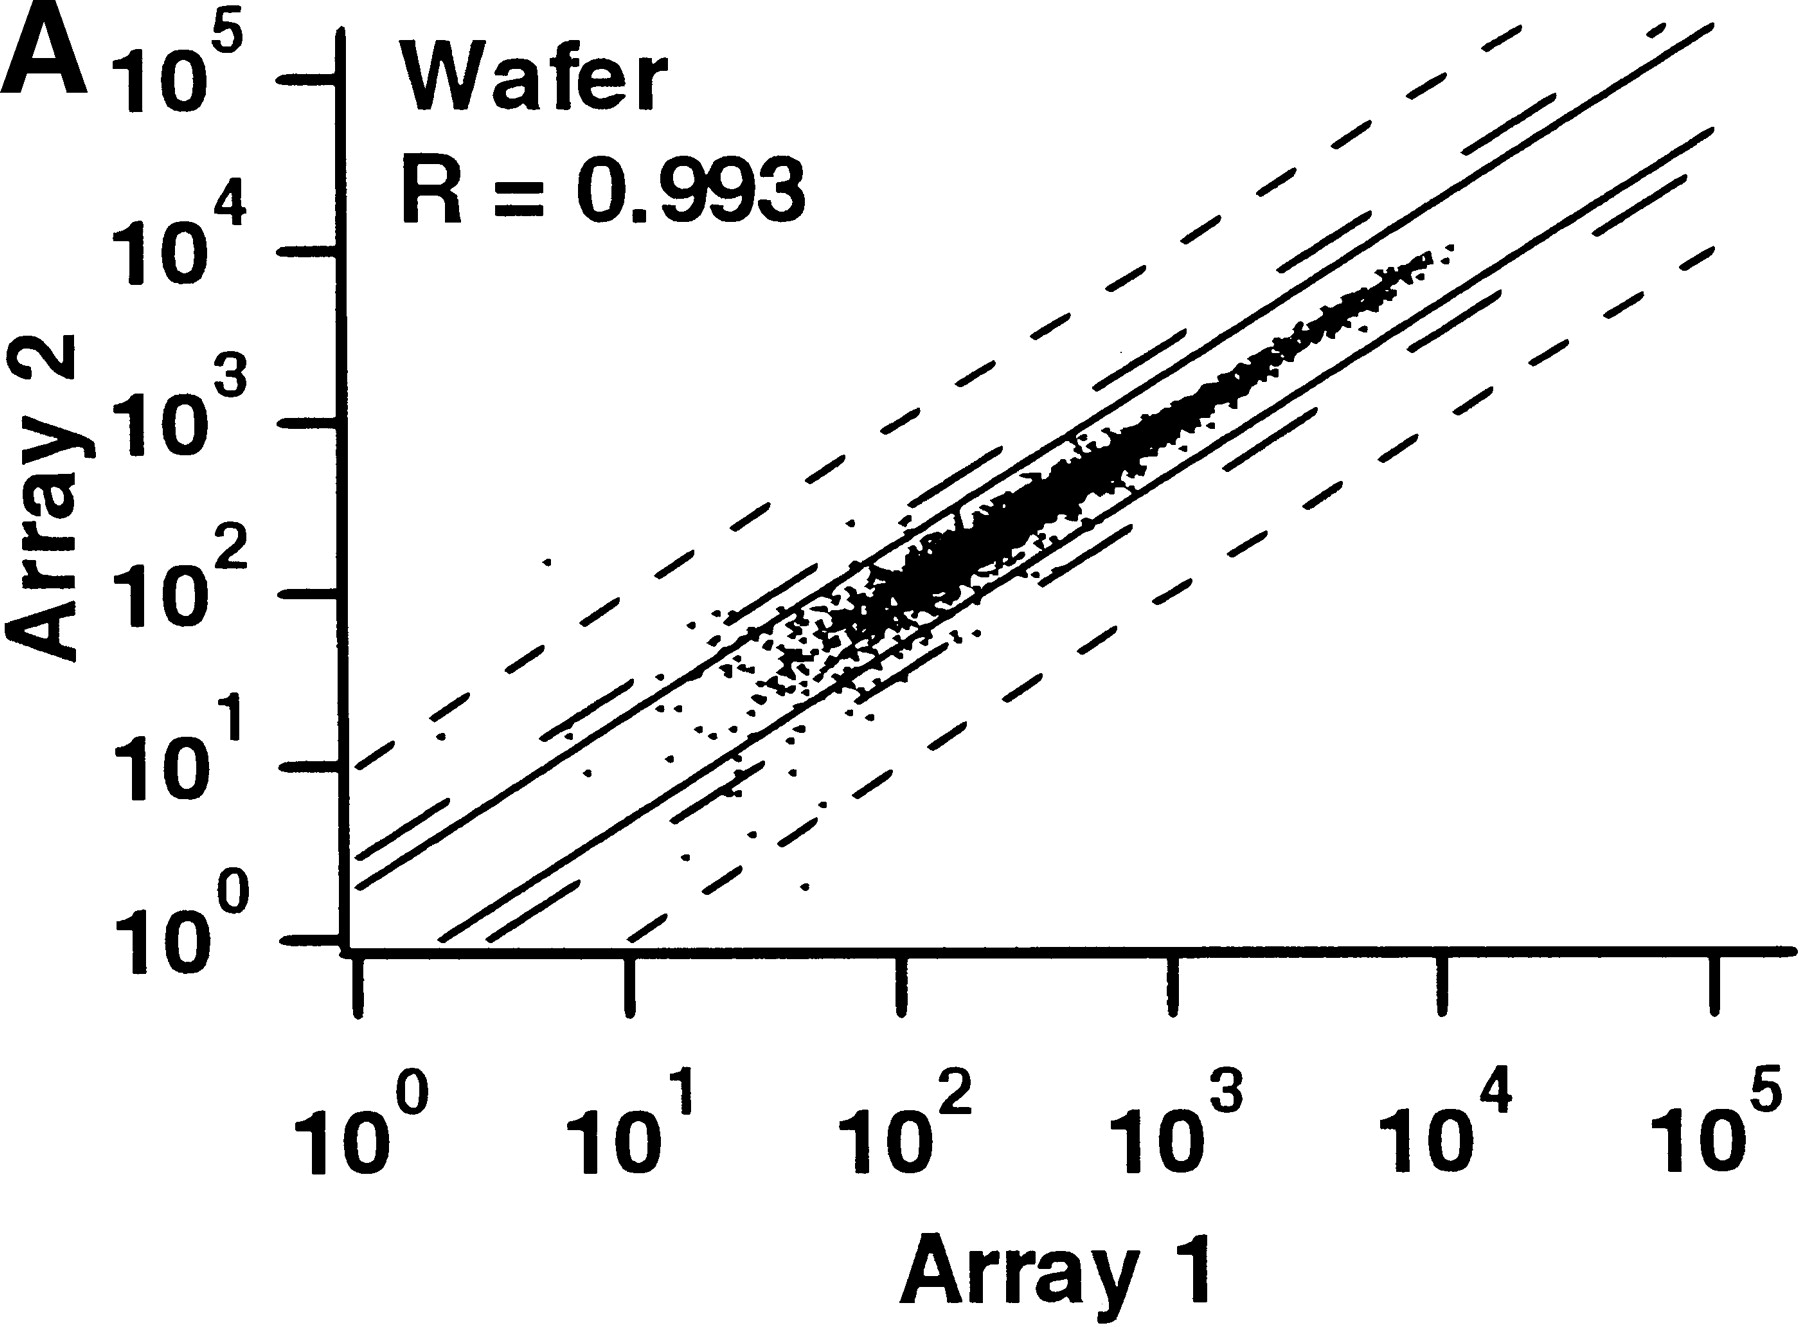


Figure 3.
Comparison of signal intensities for individual genes from independent hybridizations of mixed breast and prostate cancer cell line RNA. For each comparison, only those genes scored as present on at least one of the two arrays are shown. The solid lines correspond to a twofold difference in signal intensity, the long broken lines to a threefold difference, and the short broken lines to a tenfold difference. (R) The correlation coefficient. (A) Identical samples hybridized to two different arrays on the same wafer. (B) The same samples hybridized to two separate, individual chips. (C) Comparison between array 1 in A and array 1 in B.


