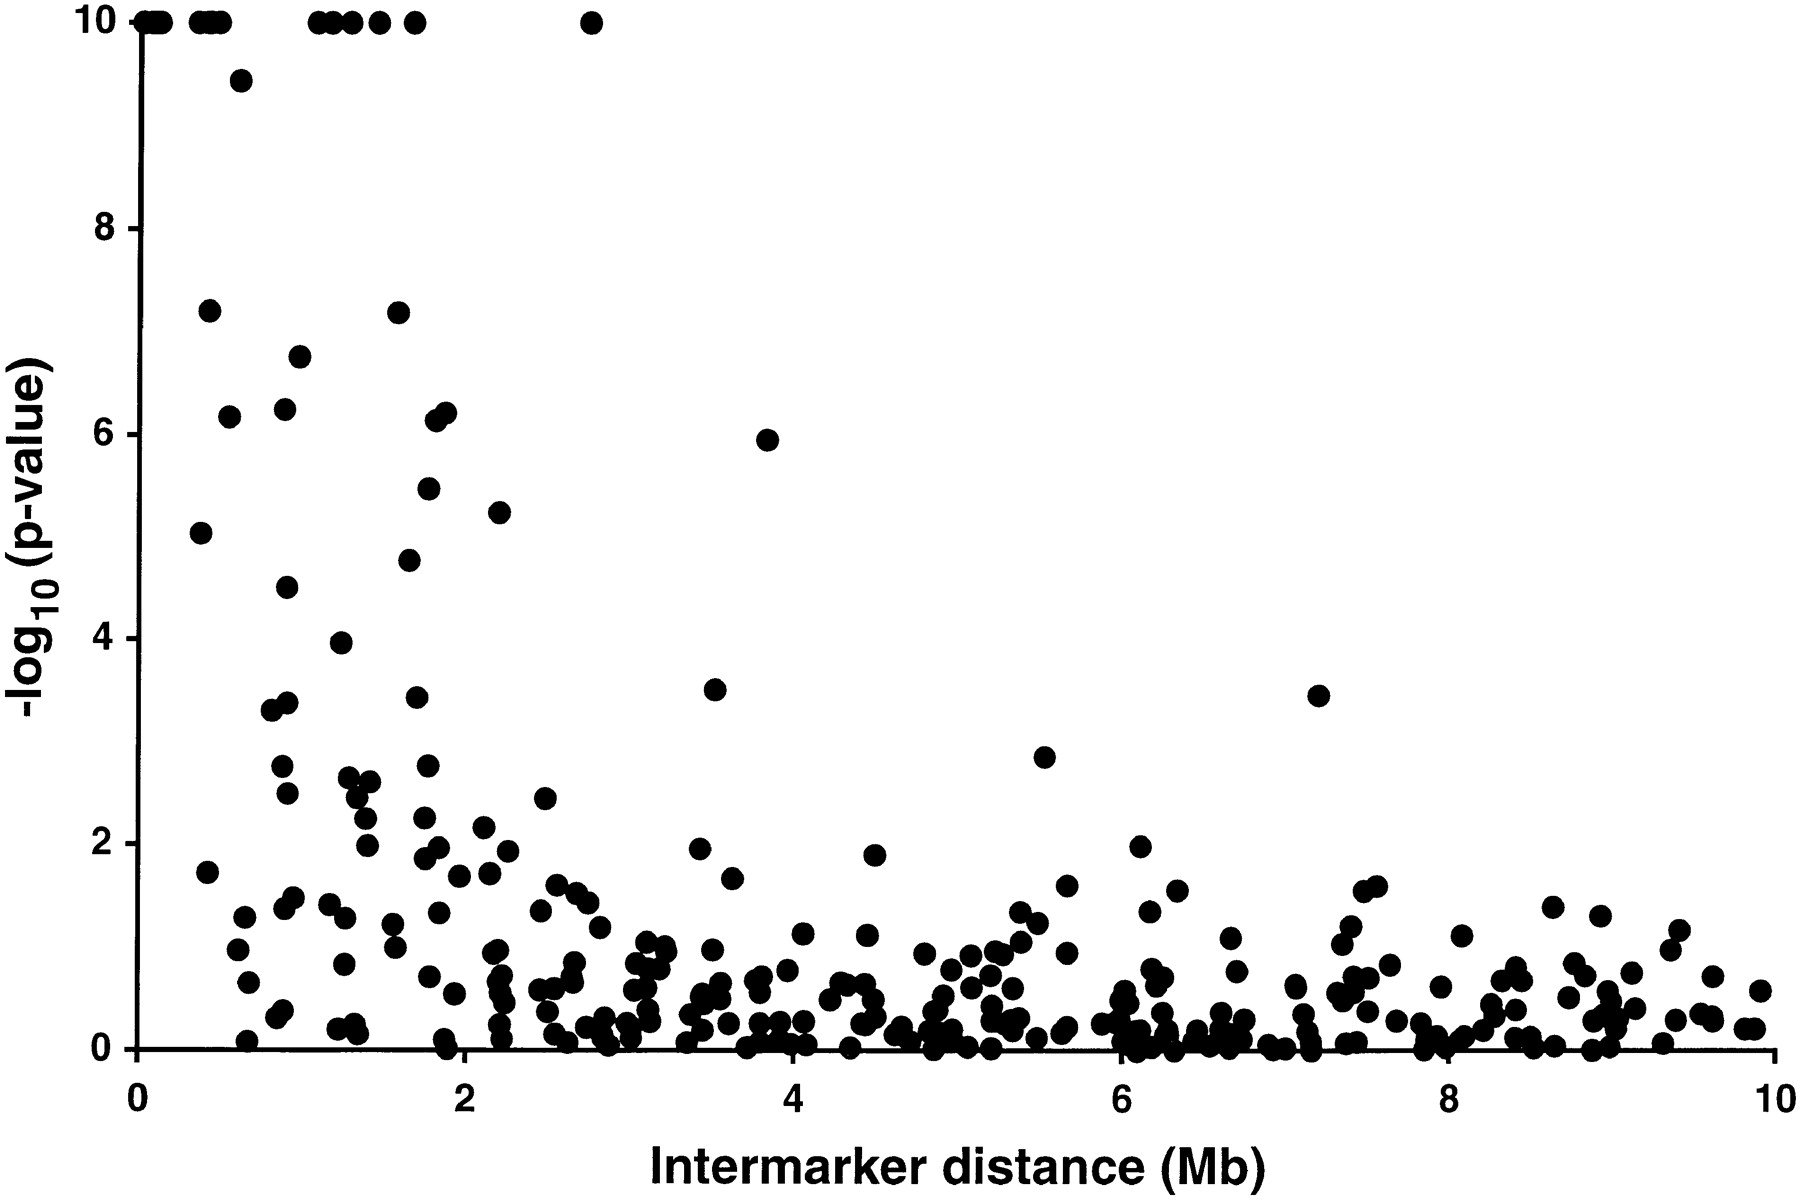
Linkage Disequilibrium Between Microsatellite Markers Extends Beyond 1 cM on Chromosome 20 in Finns

(Downloading may take up to 30 seconds. If the slide opens in your browser, select File -> Save As to save it.)

Click on image to view larger version.

Figure 3.
Figure 3.

LD versus physical distance. −log10(P-values) for a likelihood ratio statistic, limited at 10−10. Each point represents one pair of markers. Two hundren ninety marker pairs up to 10 Mb apart are shown.

This Article

  1. Genome Res. 11: 1221-1226

Preprint Server