
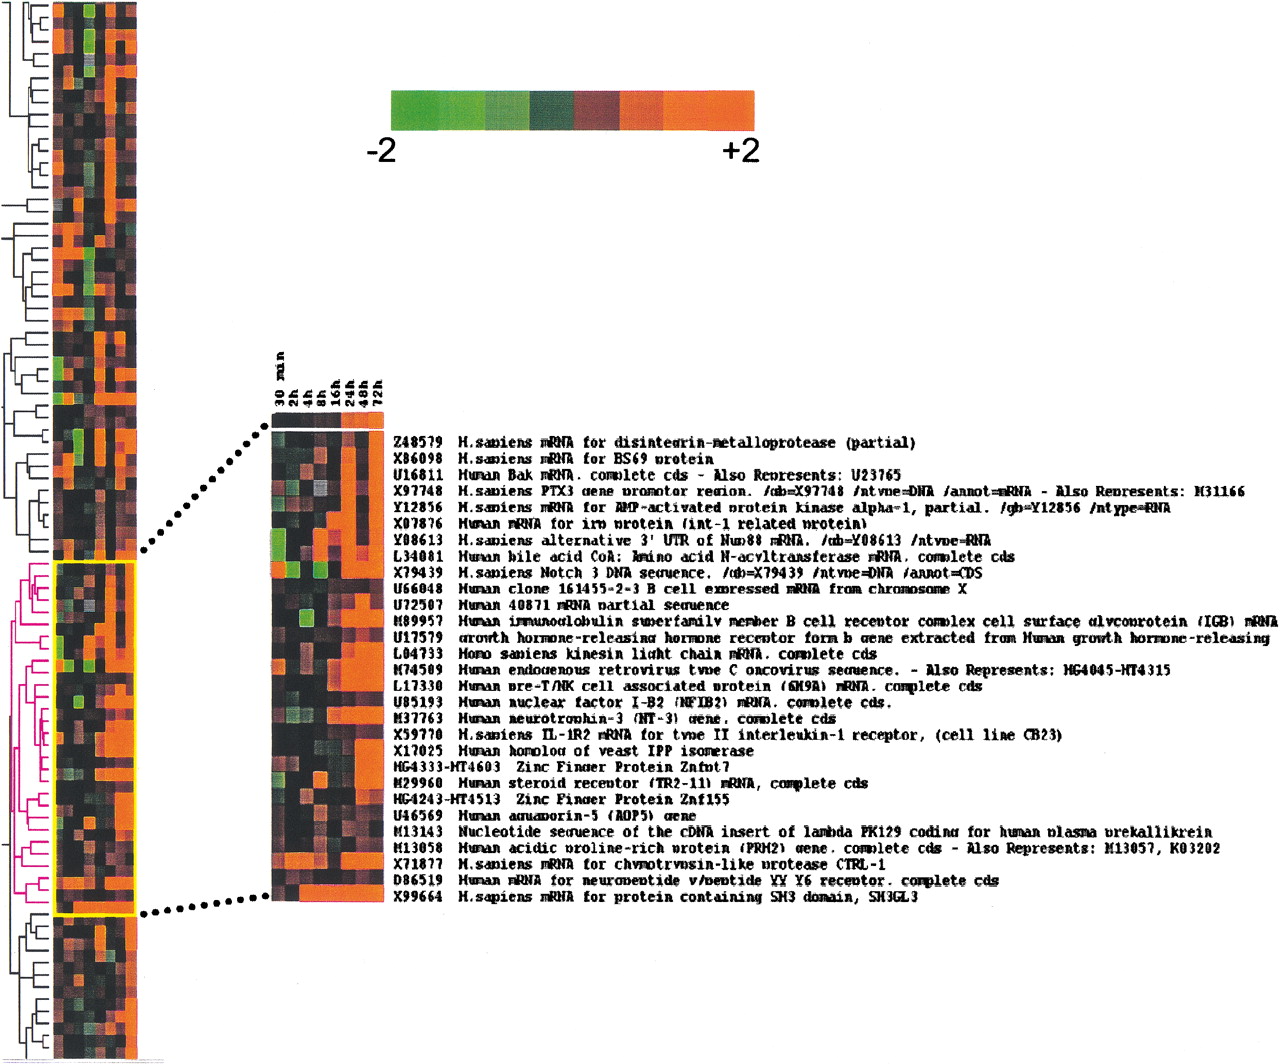
Hierarchical cluster analysis. We selected genes with average difference values >50 for at least four out of the eight time points. Also, the ratio of the average difference of HIV over control had to be ≥2 (422 genes met the criteria). The data then were processed using Cluster. The values were log transformed, and self-organizing map was applied (100,000 iterations) prior to generating the hierarchical clusters. The display software Treeview was used to render the figure. Cross section of the tree and magnification of a subset of the hierarchical cluster showing genes that clustered with NFIB-2. These selected genes were overexpressed as compared to control at the later time points. Intensity of color from bright green to bright red (log scale) is shown. (Green) overexpressed in control; (red) overexpressed in HIV-infected population.


