
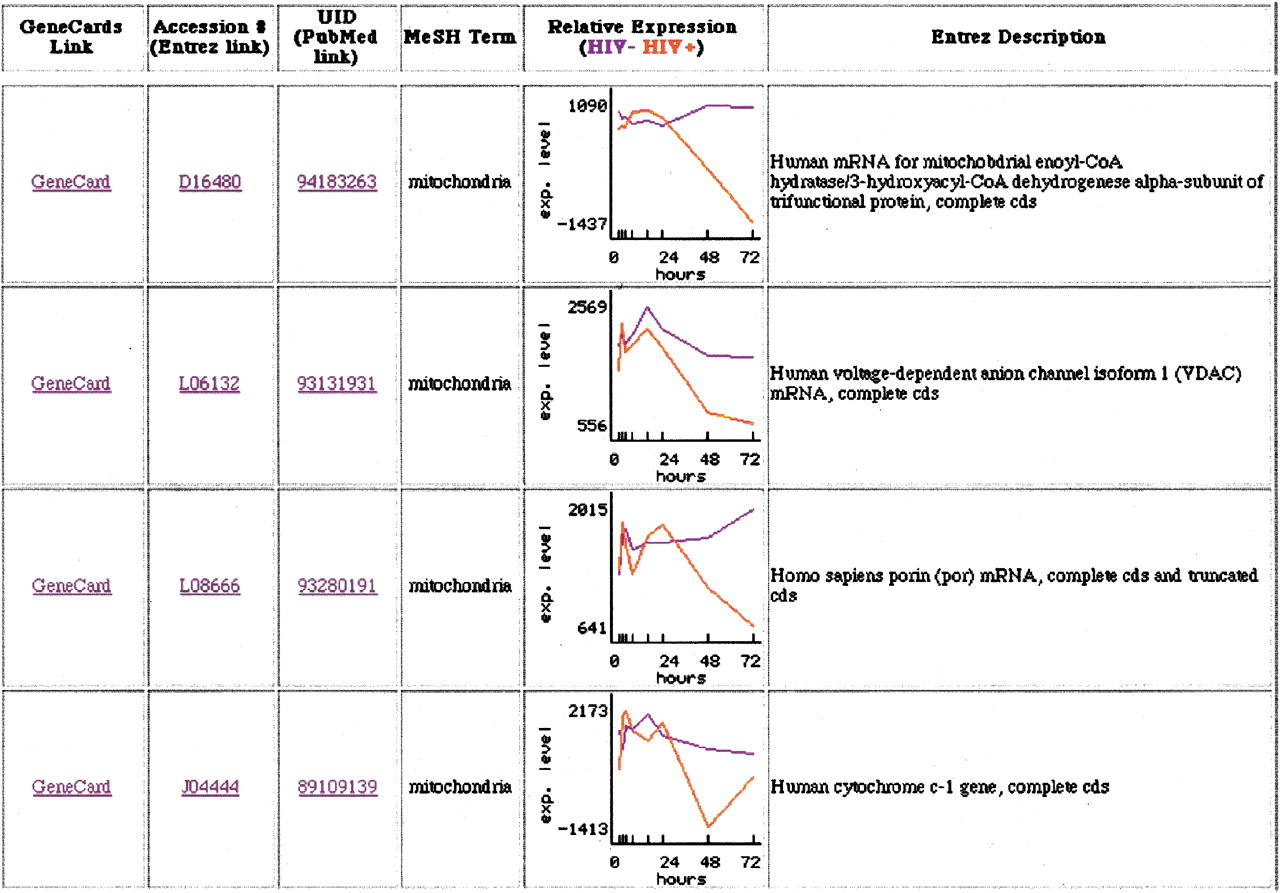
Figure 3.
Selected mitochondrial-associated genes modulated by human immunodeficiency virus (HIV) infection. (Blue) control condition; (red) HIV-infected cells. An additional link to GeneCard, Entrez, and PubMed also are displayed with the Entrez description for the gene. Clicking on the graph itself provides the average difference values and call made by the initial GeneChip analysis suite software. Average difference values of <35 reflects that the gene is not present (includes negative values).


