
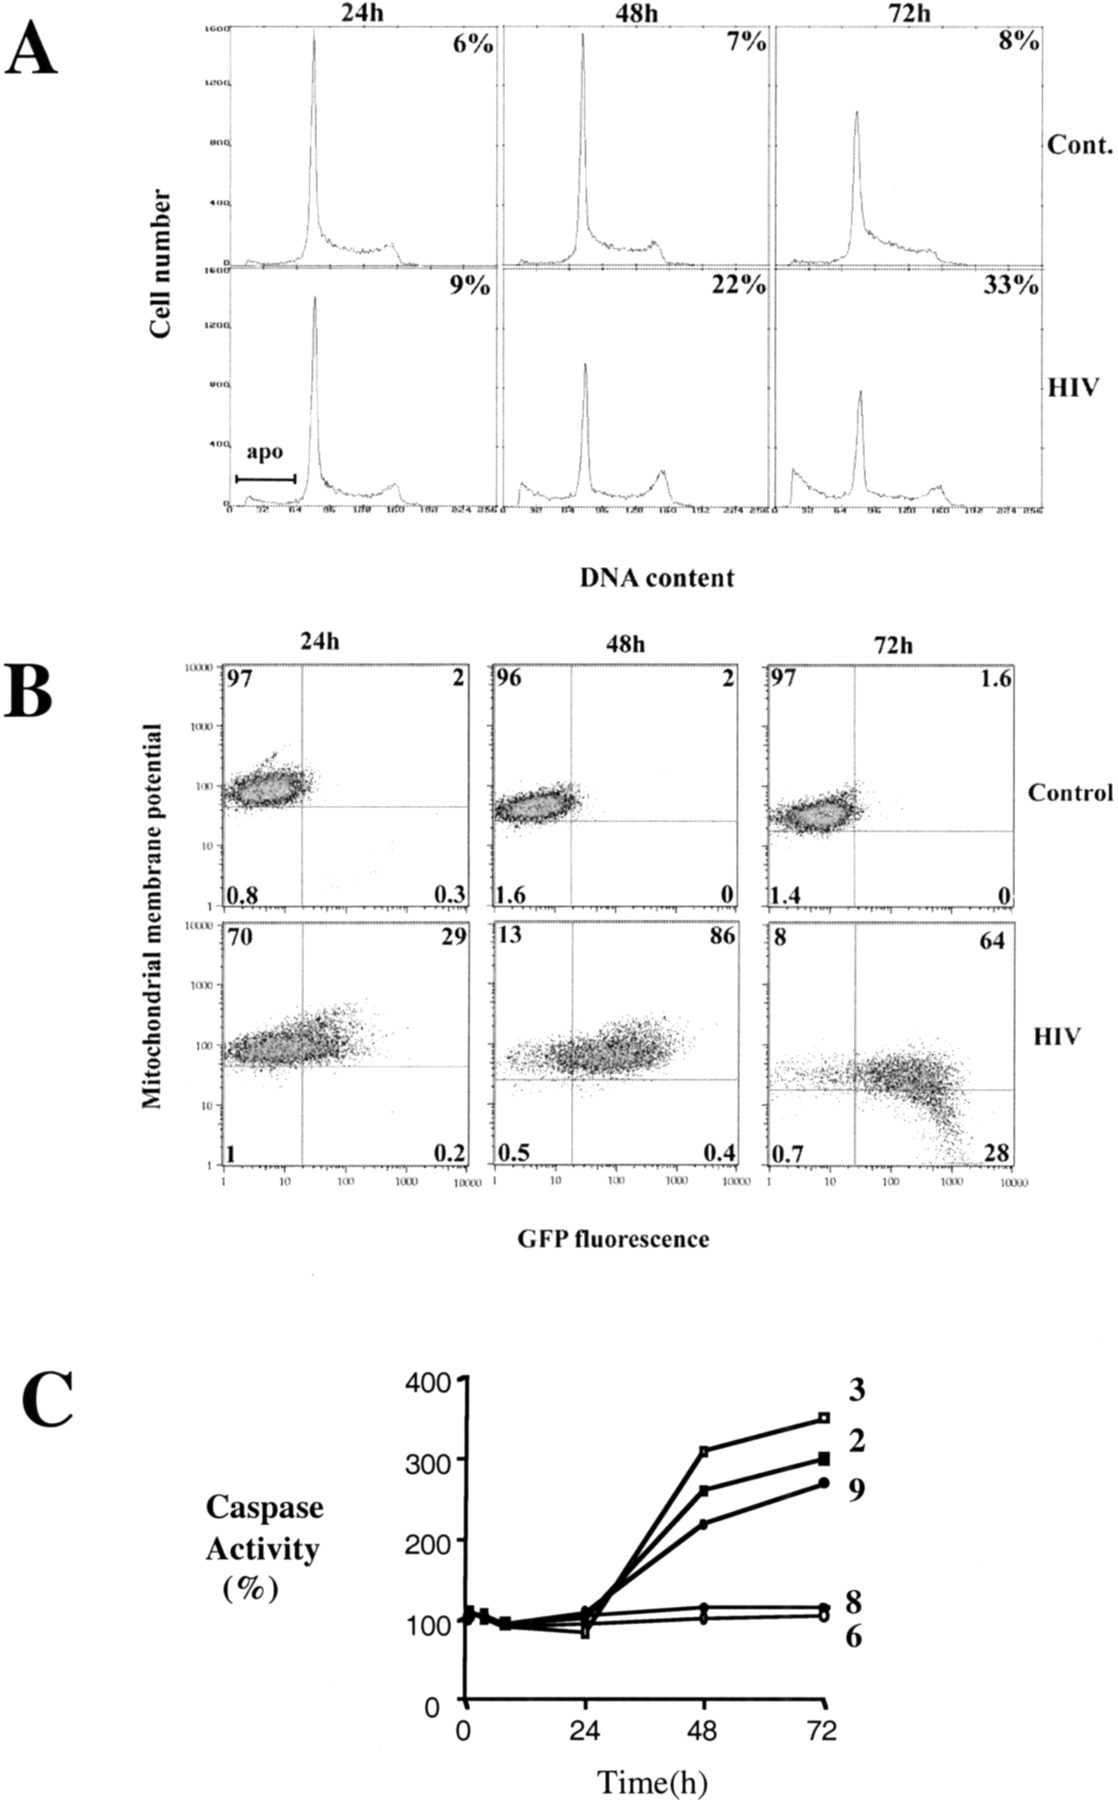
Analysis of DNA content, cell cycle, percentage of infected cells, mitochondrial membrane potential, and caspase activity. (A) Cell cycle analysis and quantification of apoptosis. Control (mock-infected) and human immunodeficiency virus type 1 (HIV-1) -infected CEM-GFP cells were processed after 24 h, 48 h, and 72 h for DNA content using propidium iodide staining. An assessment of the percentage undergoing apoptosis (upper right corners) was performed by estimating the proportion of cells with subgenomic content of DNA (labeled apo in the figure). The percentages for 24 h, 48 h, and 72 h were 9%, 22%, and 33%, respectively. (B) Determination of the percentage of HIV-infected cells and evaluation of the mitochondrial membrane potential (Δψm). The percentage of GFP-positive cells (cumulative of the percentage present intop and bottom right quadrants) is an assessment of the number of cells productively infected. The percentages for 24 h, 48 h, and 72 h were 29%, 86%, and 92%, respectively. Cells were gated initially using forward and side scatter criteria to exclude dead cells. Orange-fluorescent tetramethylrosamine was used to assess the mitochondrial transmembrane potential. Gating on live cells only, 28% of cells that were GFP positive (92%) showed reduced staining at 72 h. (C) Cells were infected with HIV-1LAI at 0.5 MOI. At the indicated time points, 2 × 10⁶ cells were washed with PBS and lysed in caspase buffer. Caspase activity of 10–20 μg of total protein was measured with specific substrates for caspase-2 (◼), 3 (■), 6 (◈), 8 (⧫) and 9 (●) (100 μM) after 1 h incubation at 37°C.


