
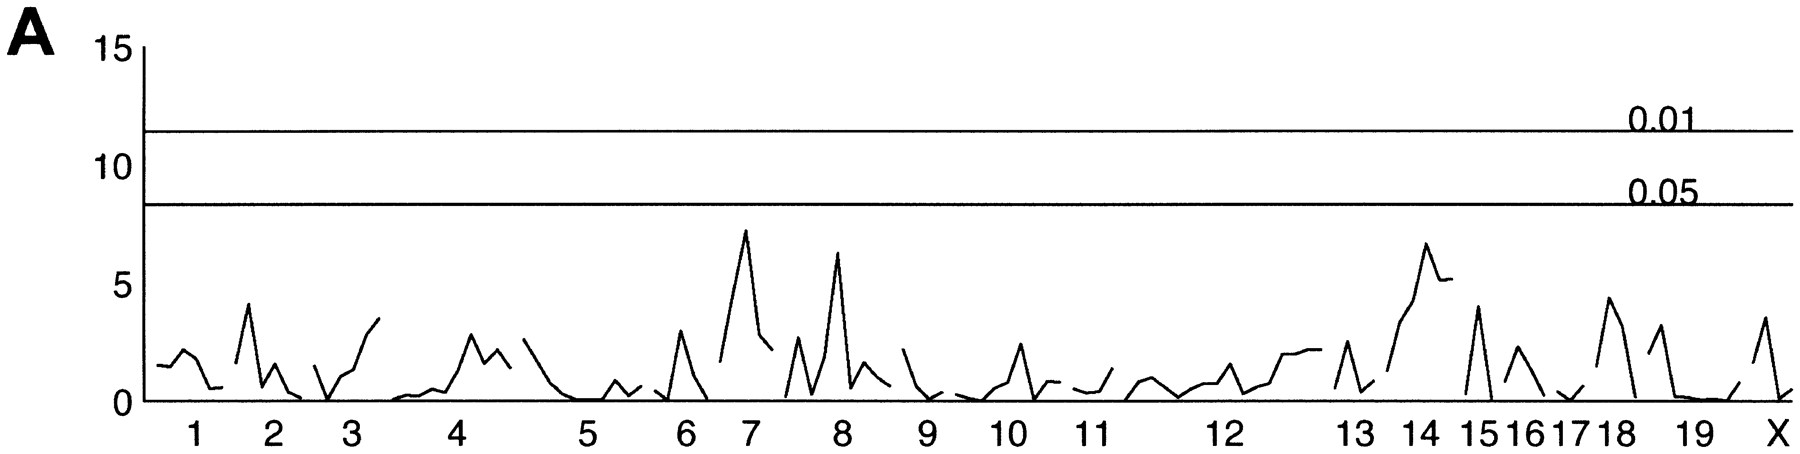
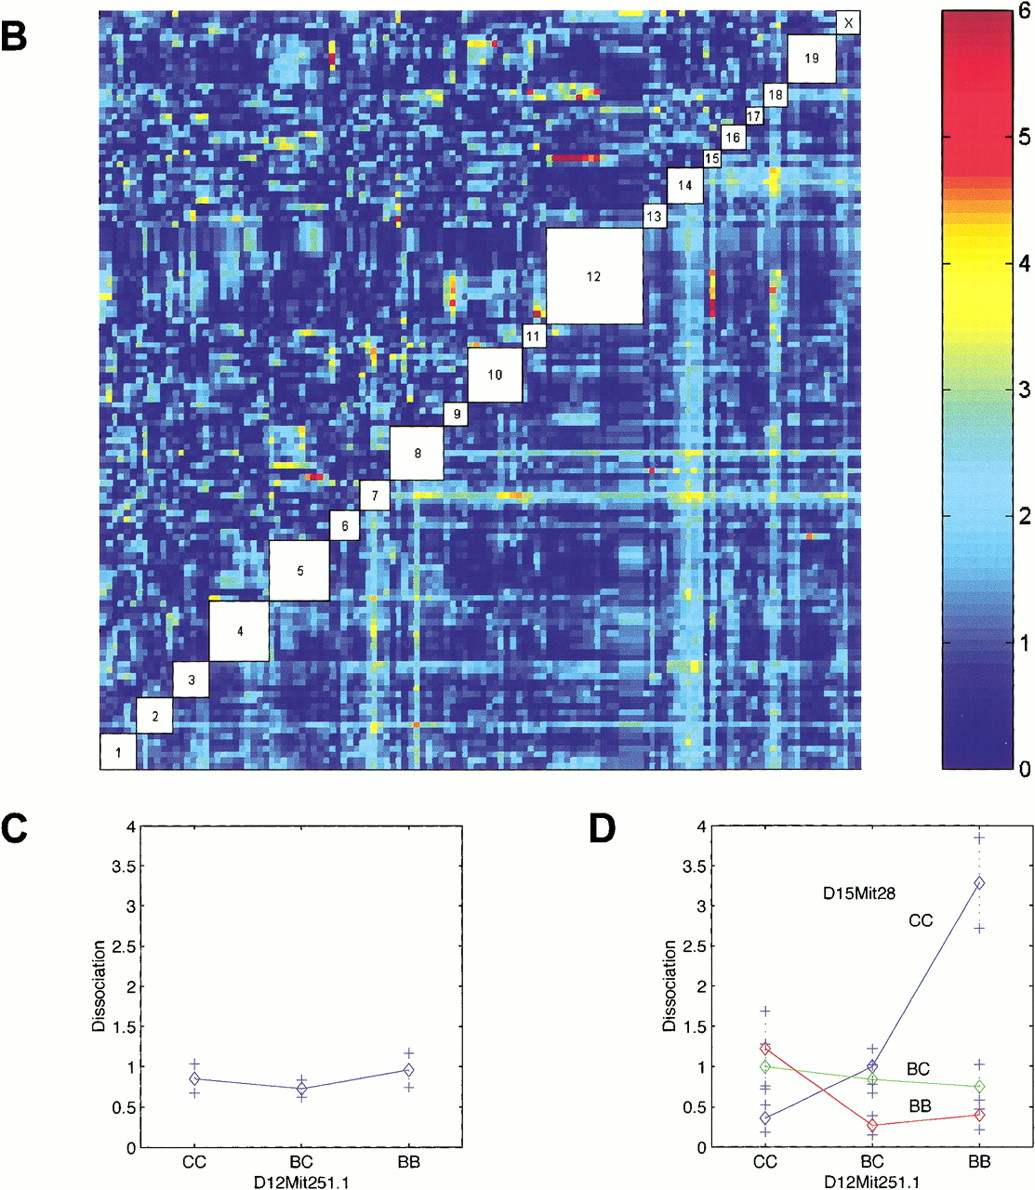
Figure 8.
Genome-wide scan for dissociation phenotype. (See Fig. 4 for plotting details.) (A) Single marker regression genome scans for dissociation. (B) Pairwise marker regression genome scans. (C) Main effect of Disso-1. (D) Pairwise interaction of Disso-1 and Disso-2.


