
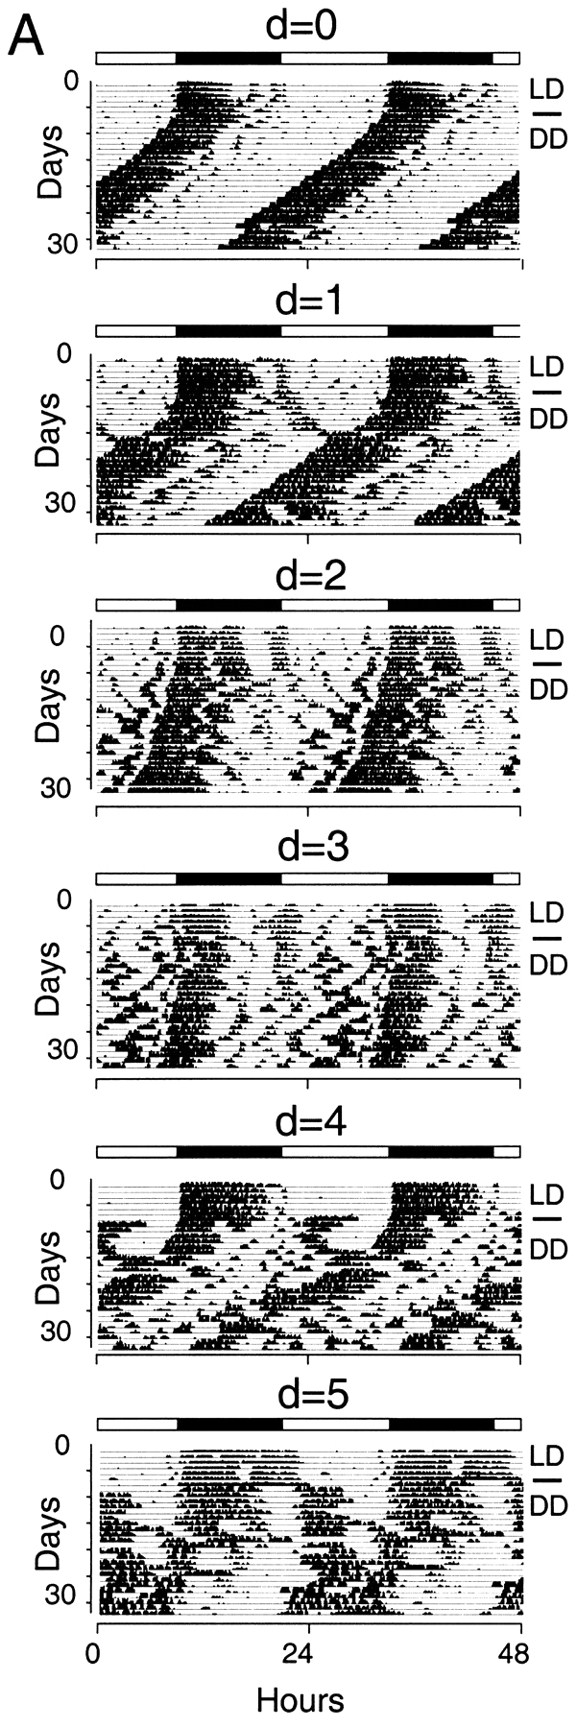
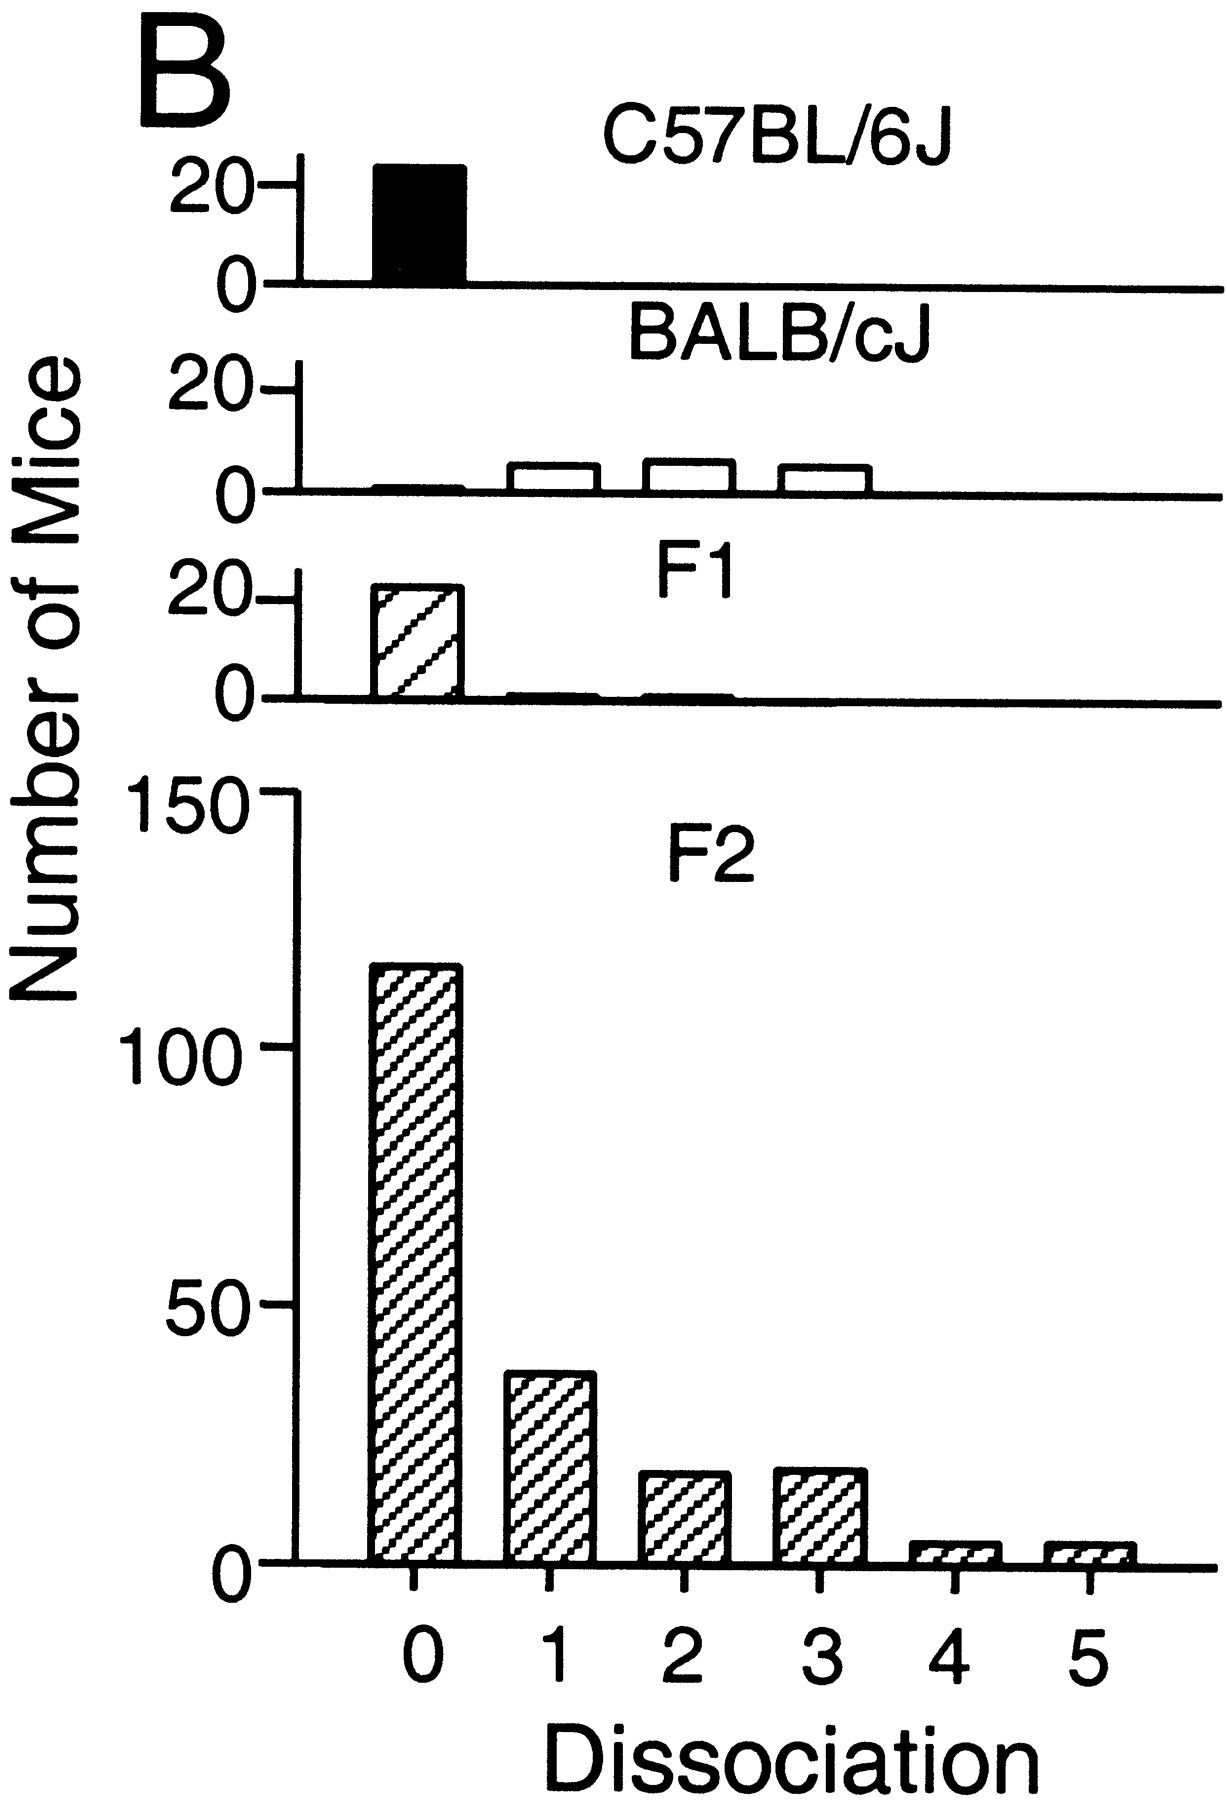
Figure 3.
Phenotype distribution of dissociation trait. Dissociation of individual activity records were assigned to one of six classes of dissociation scores by two observers, with zero representing the least and five representing the most dissociated activity pattern. (A) Representative activity records of each dissociation score are presented. The plotting format is identical to Figure 1. (B) Distribution histograms of dissociation scores are presented in the following order from top tobottom: C57BL/6J, BALB/cJ, (BALB/cJ X C57BL/6J)F1, (BALB/cJ X C57BL/6J)F2.


