
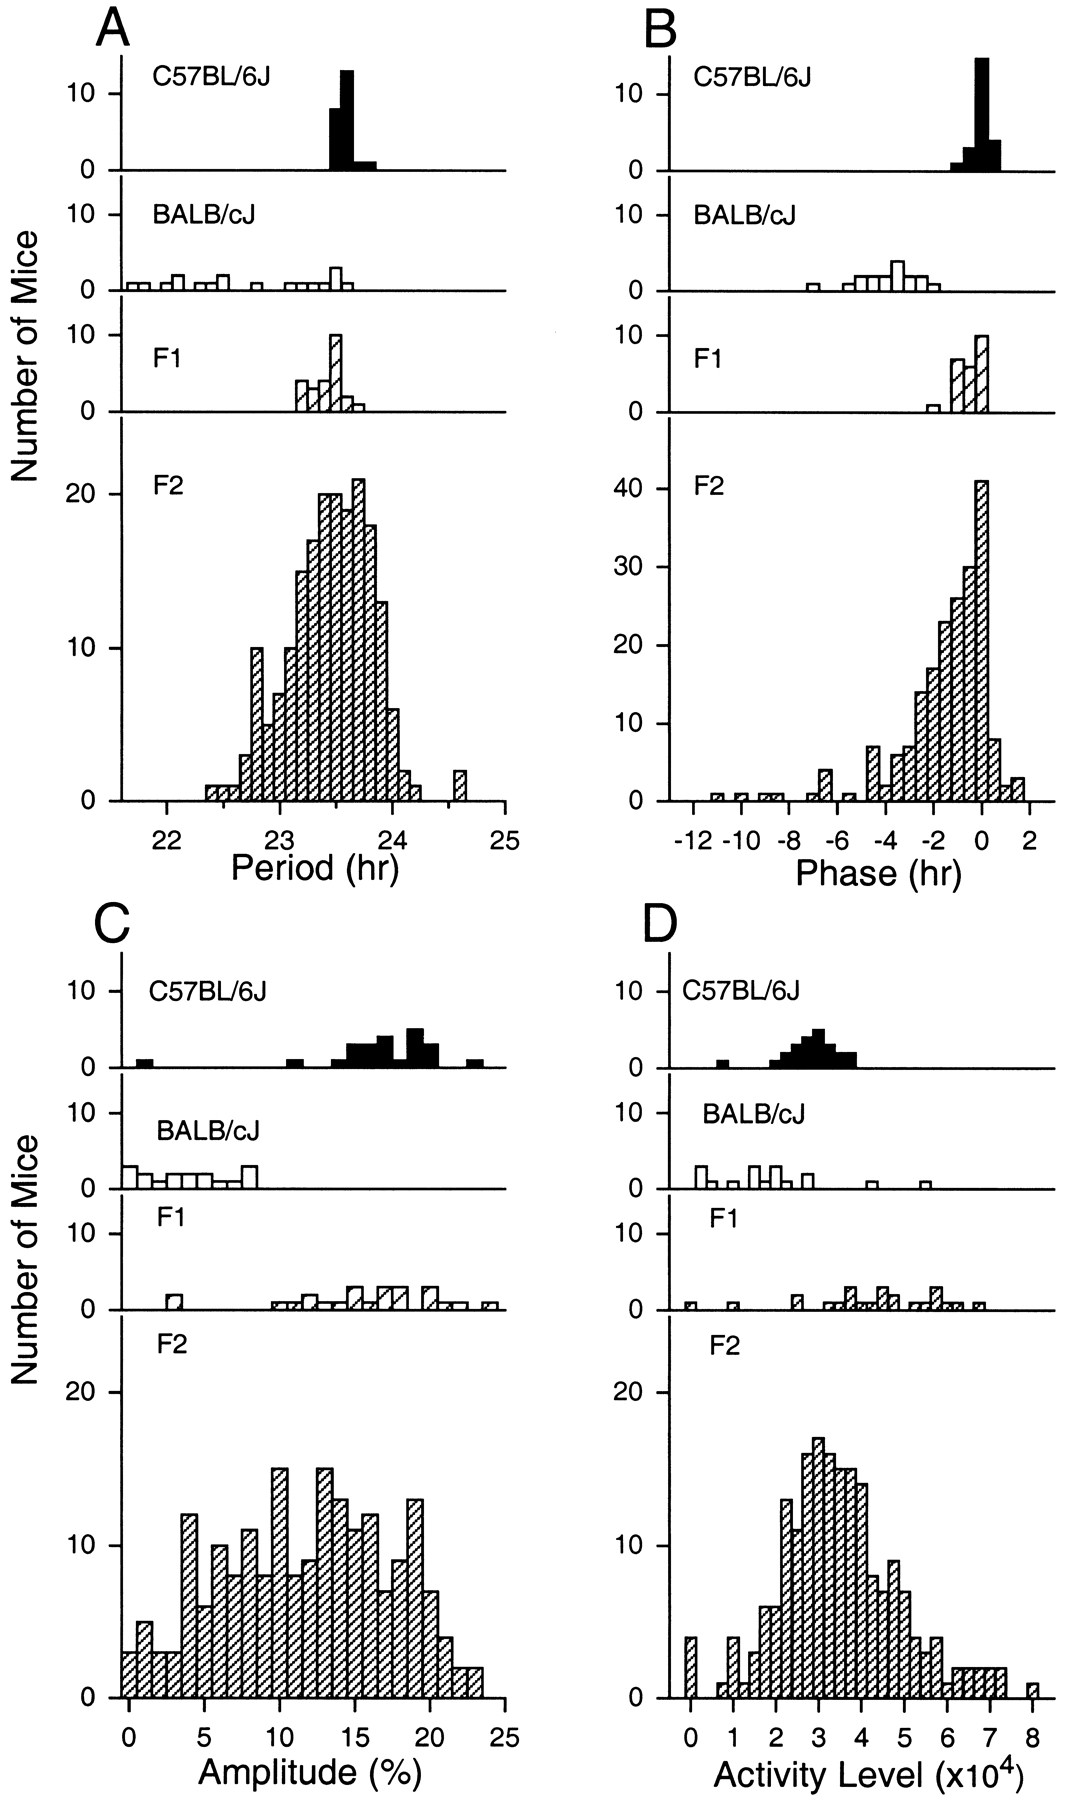
Frequency histogram of phenotypic measures for each generation. For each panel, the distribution histograms are presented in the following order from top to bottom: C57BL/6J, BALB/cJ, (BALB/cJ X C57BL/6J)F1, (BALB/cJ X C57BL/6J)F2.(A) The distribution of free-running period in constant darkness, as determined by χ2periodogram analysis of 20 days. Data is presented in 1/10 h bins. (B) The phase angle of entrainment, relative to the time of lights off. Values are plotted in 1/2 h bins, with positive values indicating activity onset preceding lights-off, and negative values indicate activity onset following lights-off. (C) The distributions of amplitude of circadian rhythmicity in constant darkness. Amplitude is estimated from the Fast Fourier Transform of 15 days' data in constant darkness. The total power from 0 to 1 cycles/hour is normalized to a value of 1.0, and the resultant relative power of the peak in the circadian range (18–30 h period) is taken as a measure of circadian amplitude. (D) The distributions of mean total daily activity levels. Values are individual mean numbers of wheel revolutions/24 h for 15 d in constant darkness.


