
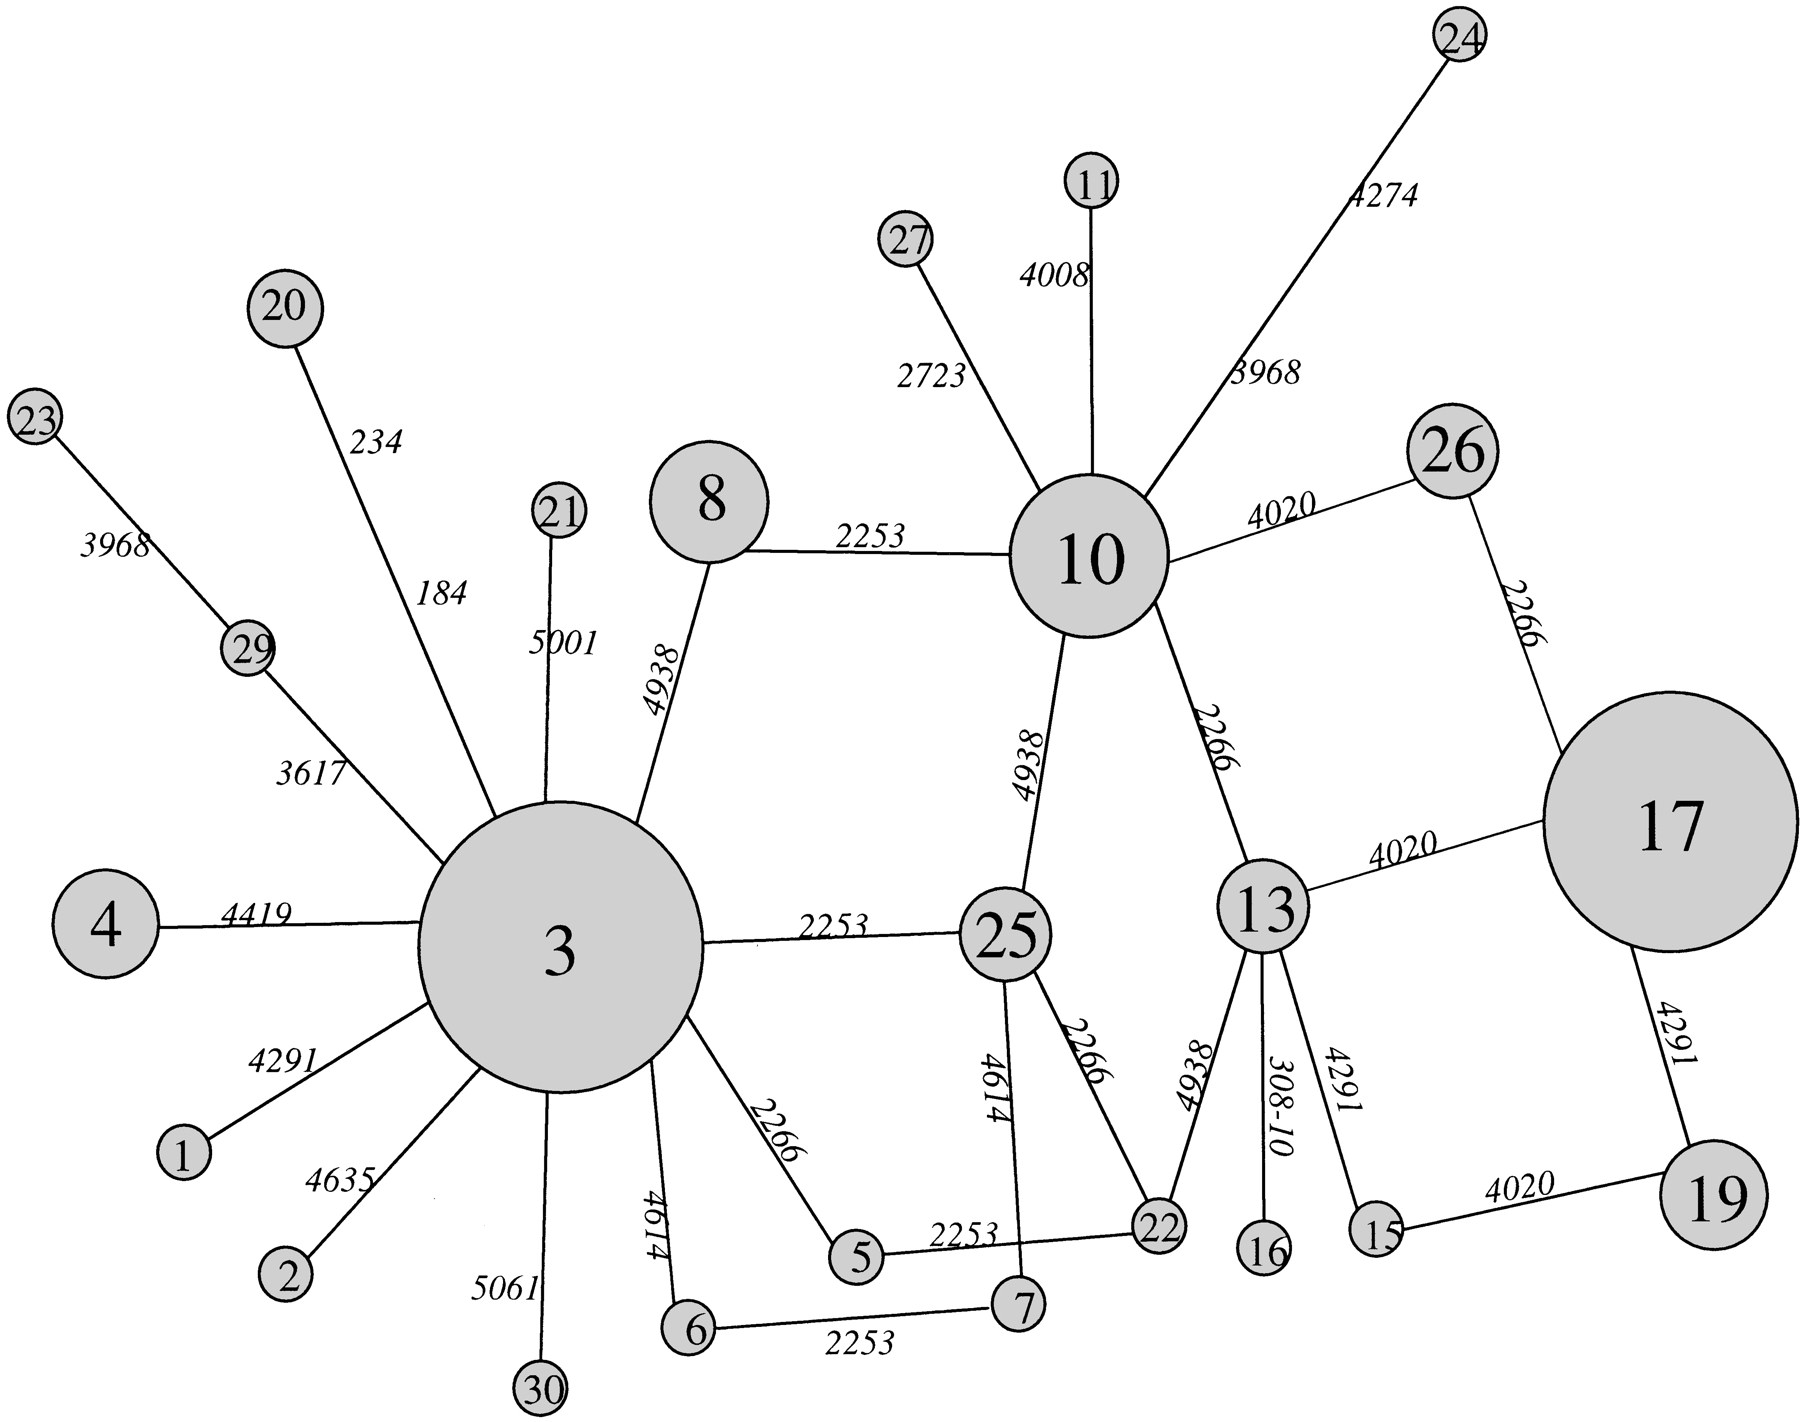
Figure 4.
Median network constructed from the 25 haplotypes in our sample. Haplotype number is shown inside the circles, and mutation positions are indicated on the branches linking two haplotypes. Circle areas are proportional to the frequency of the haplotypes. Branch lengths are proportional to the number of mutational events they represent.


