
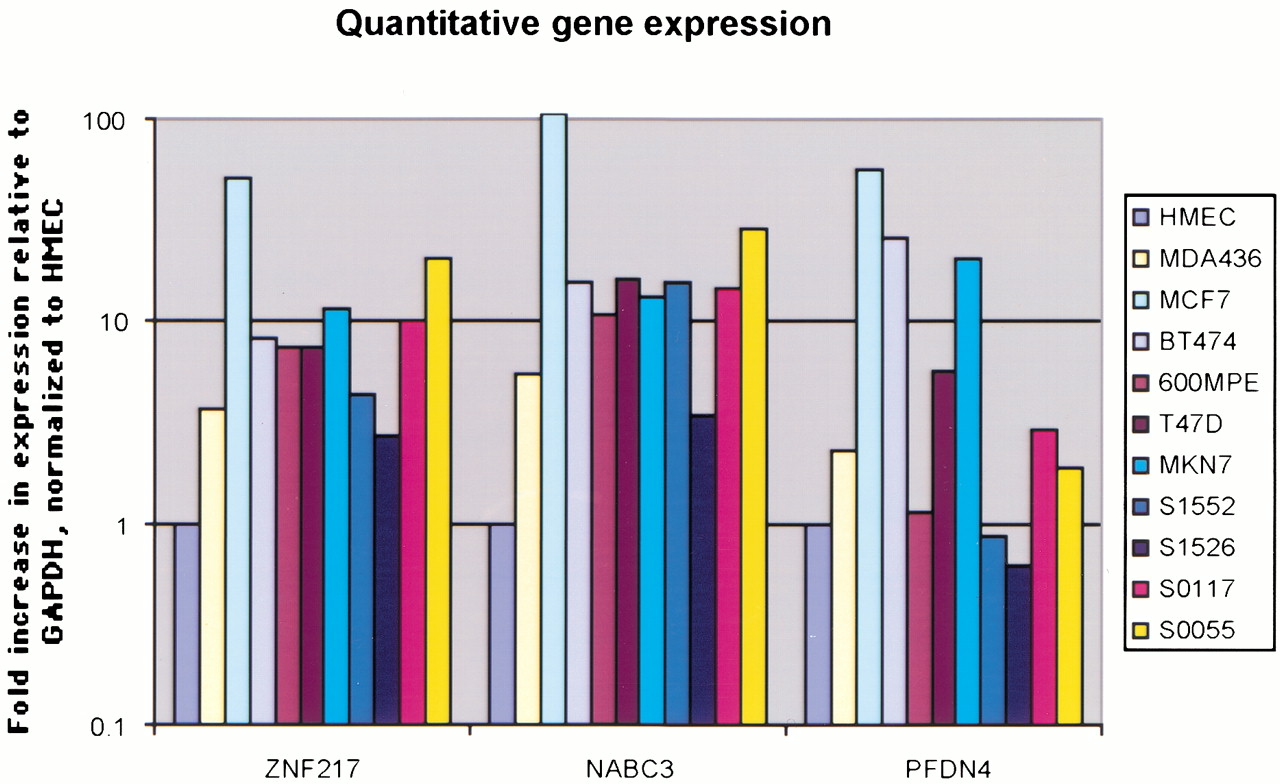
Figure 4.
RNA expression levels of ZNF217, NABC3, and PFDN4 in six cell lines and four mammary tumors. Transcript levels are calculated as 2-ΔN (Albertson et al. 2000) with GAPDH as a reference gene and relative to the expression levels as measured in the human mammary epithelial cells (HMECs). As a control, expression levels were measured with GUS as a reference gene, which also showed nearly identical expression profiles for ZNF217 and NABC3 (not shown). Cultured HMECs, cell lines MCF7, MDA436, BT474, 600MPE, T47D, and MKN7, primary tumors S1552, S1526, S0117, and S0055 were used as a source of template mRNA for this experiment.


