
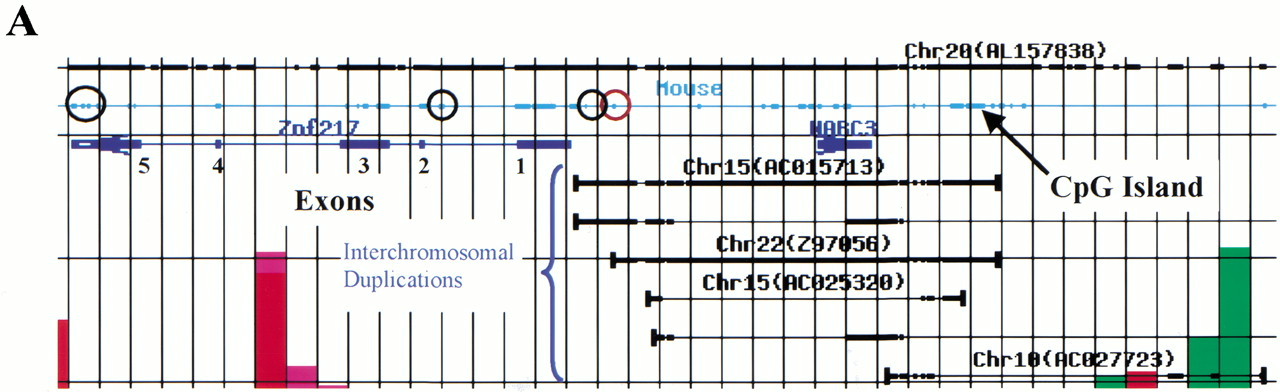
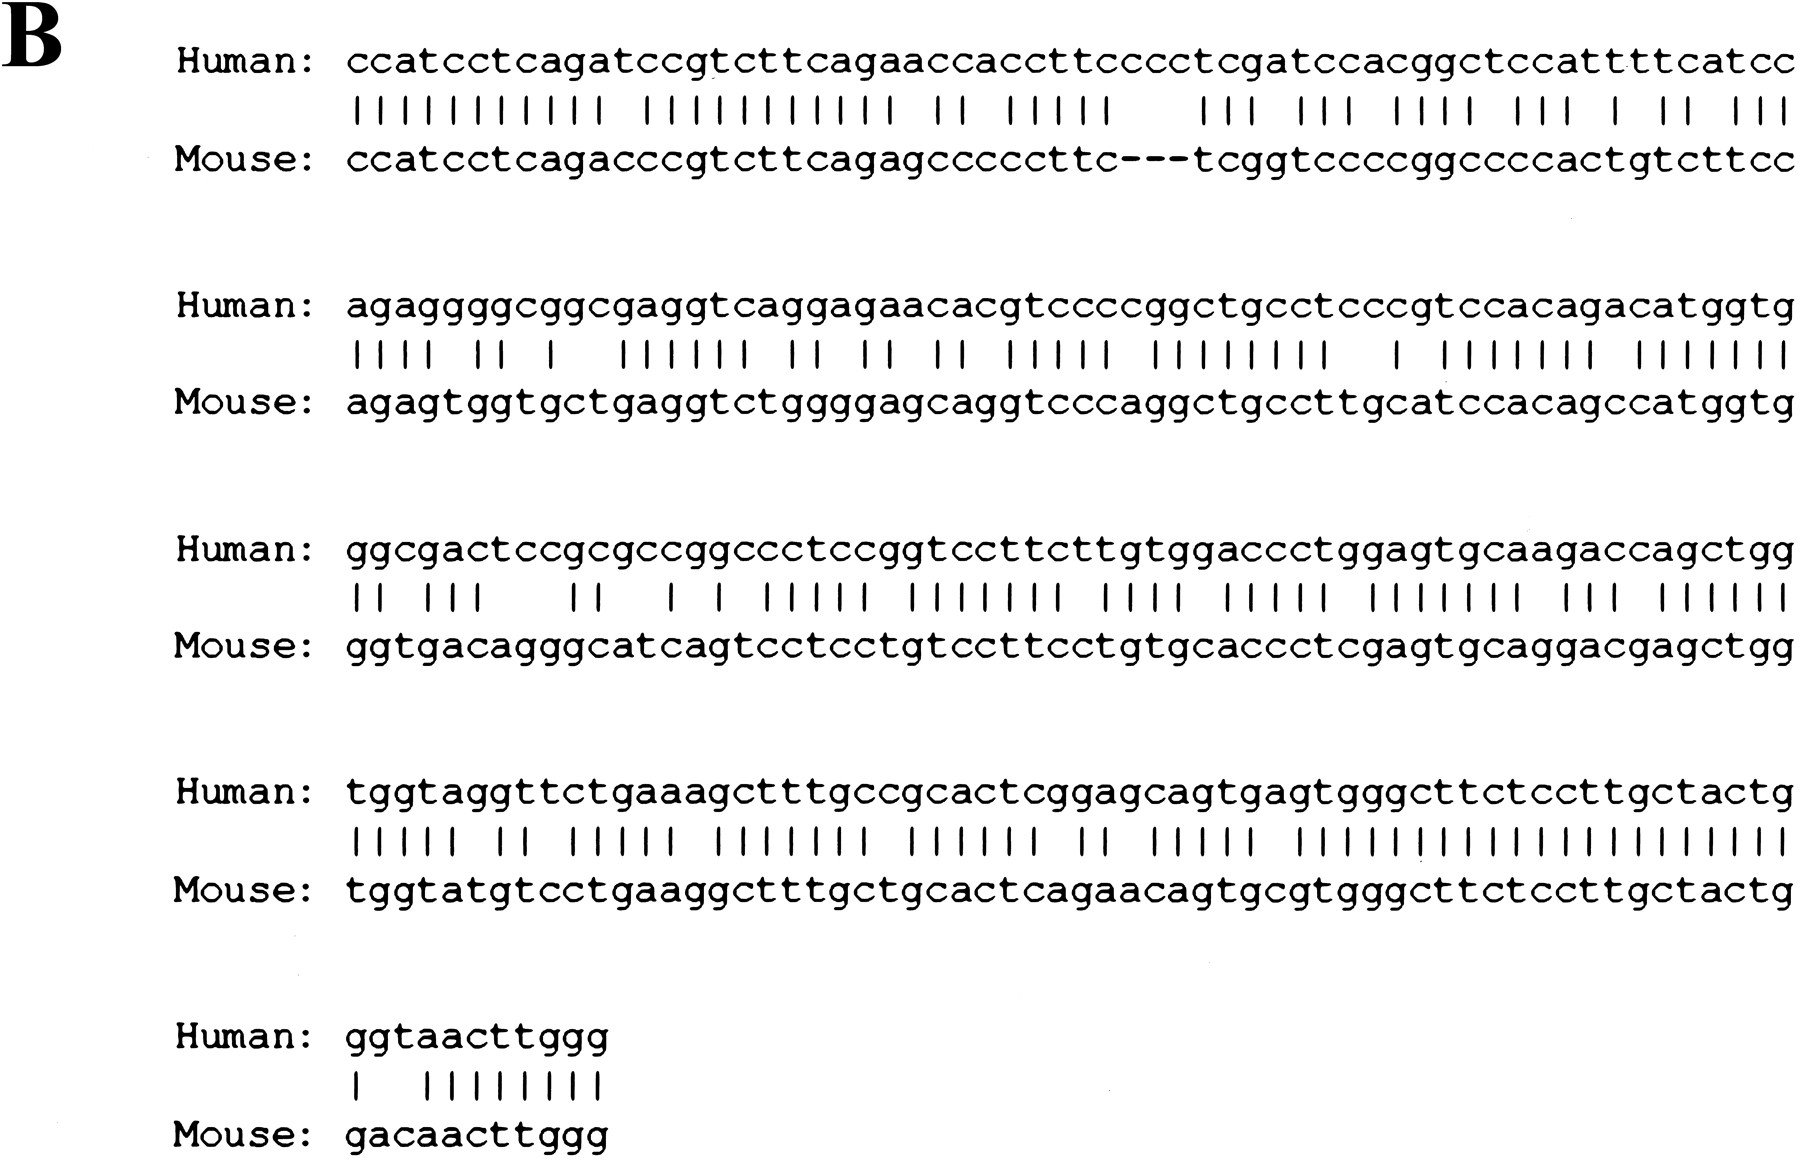
(A) A high-resolution Genome Cryptographer (GC) analysis showing human/mouse sequence alignment. GC analysis was carried out in an analysis interval of 1 kb. This figure shows a chromosome 20 PAC (AL157838) in black. The extent of syntenic mouse sequence is indicated by a thin blue line with sequence identities shown as heavy lines. Human genes ZNF217 and NABC3appear as dark blue arrows pointing in the direction of transcription. Bracketed lines show interchromosomal duplications. Their extent is shown as thin black lines with actual sequence identities indicated by heavy black lines (e.g., Chr15, AC015713). (B) Sequence alignment of noncoding conserved human and mouse sequence (circled in red on the GC analysis in A).


