
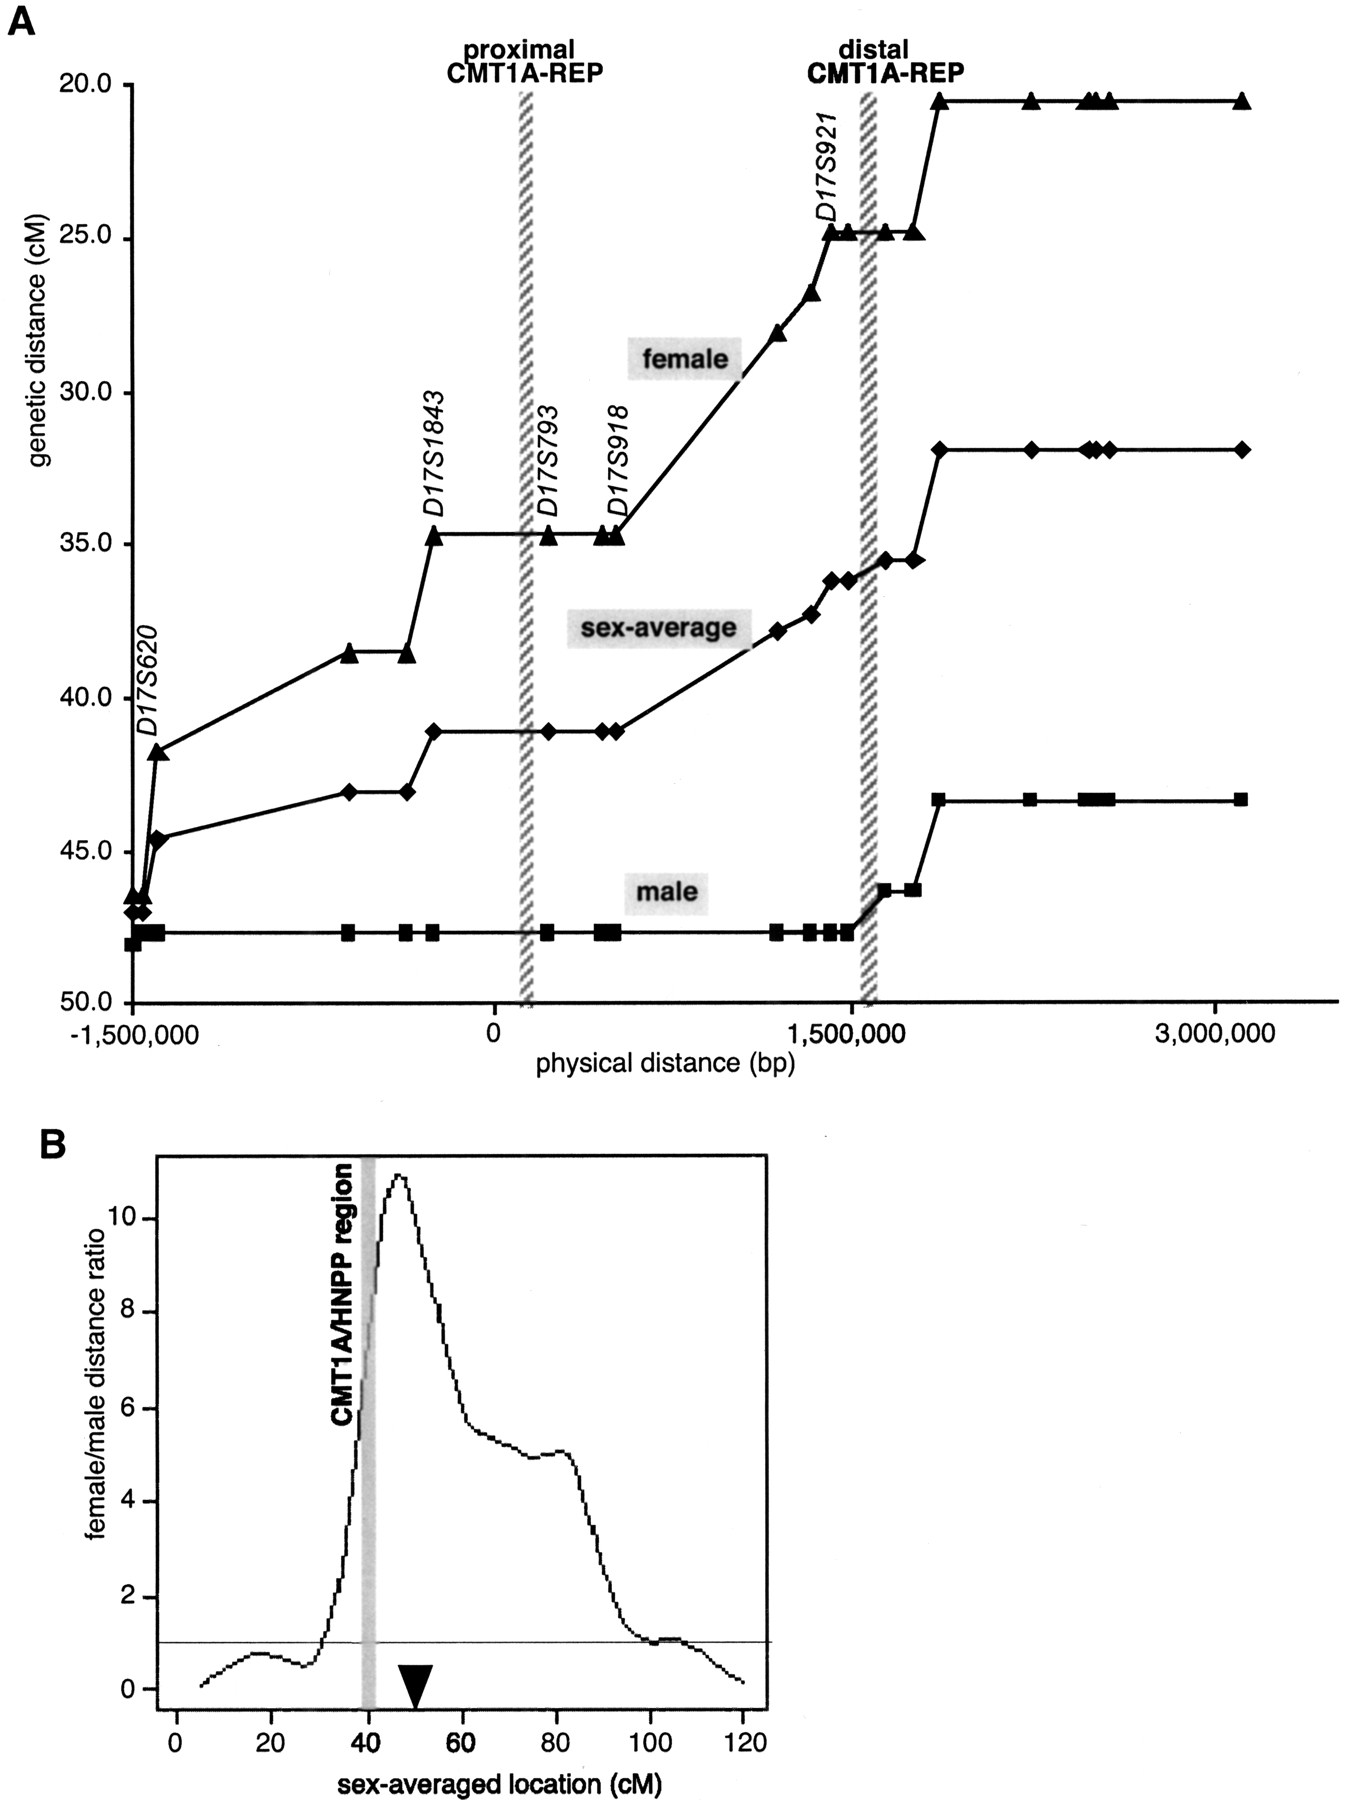
Sex-specific recombination frequencies in the CMT1A/HNPP genomic region. (A) The relationship between genetic and physical distance. The STR markers in the 17p12 CMT1A/HNPP region from the Marshfield genetic map were aligned to the nucleotide sequence-based physical map. The marker order is as follows: centromere-D17S1794-D17S620-D17S2196-D17S1857-D17S953-D17S1843 -D17S793-D17S122-D17S918-D17S839-D17S955-D17S921-D17S900 -D17S922-D17S1856-D17S947-D17S936-D17S639-D17S799-D17S1808-D17S1803-telomere (markers within the CMT1A/HNPP genomic region are underlined). Both CMT1A–REPs are shown as hatched bars. As the sequencing of the centromeric side of the map has not yet been completed, the physical distance was calculated on the basis of the BAC contig map (K. Inoue, K. Dewar, N. Katsanis, L.T. Reiter, E.S. Lander, K.L. Devon, D.W. Wyman, J.R. Lupski, and B. Birren, unpubl.). (B) Female/male distance ratio (vertical axis) is plotted along the sex-averaged genetic map (horizontal axis). The histogram was obtained from the Marshfield Center for Genetics (http://research.marshfieldclinic.org/genetics/Map_Markers/maps/IndexMapFrames.html). The CMT1A/HNPP genomic region is shown as a shaded vertical bar. (▾) The predicted position of the centromere.


